Visualizing Outputs
We have developed an R package, swimr that
can be used to visualize certain SWIM model outputs, both longitudinally and in
comparison with other scenarios. This package can be used both as a standalone
tool in R, or as a module of SWIM to automatically produce visualizations at
the end of a run.
To install this package in the user's R environment, generally the following command is sufficient:
# install.packages("devtools") # if the devtools package is not installed
devtools::install_github("tlumip/swimr")
If you happen to be missing other dependencies, see the package README.
If you are working inside a proxy (like if you're ODOT staff), you will need to configure your proxy for GitHub installs.
library(httr)
set_config(use_proxy(url="proxynew.odot.state.or.us", port=8080))
set_config( config( ssl_verifypeer = 0L ) )
swimr is a library of functions that operate on one or more scenario SQLite
databases that the model places in outputs/. To set up a swimr environment,
the user connects to this database using the dplyr::src_sqlite function.
library(tidyverse)
library(swimr)

reference_db_path <- "~/Documents/projects/swim/scenario.db"
reference <- src_sqlite(reference_db_path)
The package manual contains detailed instructions on using the functions, and this is not intended to be a complete guide. Nevertheless, there are two basic classes of functions: single scenario and scenario comparison. These functions include both line graphs and maps.
A single scenario function typically shows change over time within a single scenario. The line graph plots a variable, usually segmented by at least one other dimension and broken up by regions, over the course of the simulation. For example, you can plot the scenario rent price over time for the Portland and Salem MPO area with
plot_floorspace(reference, facet = "MPO", facet_levels = c("Metro", "SalemKeizer"),
                price = TRUE)
swimr also includes functions to create interactive maps of scenario results using the leaflet package. To create a map of change over time within a scenario, you can do
change_leaflet(reference, year1 = 1990, year2 = 2040)
With a scenario comparison plot, you can compare the relative difference in the plot lines between two scenarios.
comparison_db <- "~/Documents/projects/swim/MFhousing.db"
comparison <- src_sqlite(comparison_db)
compare_floorspace(reference, comparison, "MPO", c("Metro", "SalemKeizer"),
                   price = TRUE)
The equivalent map is created using diff_leaflet.
diff_leaflet(reference, comparison, year = 2040, variable = "Population",
             scen_names = c('Reference', 'Comparison'))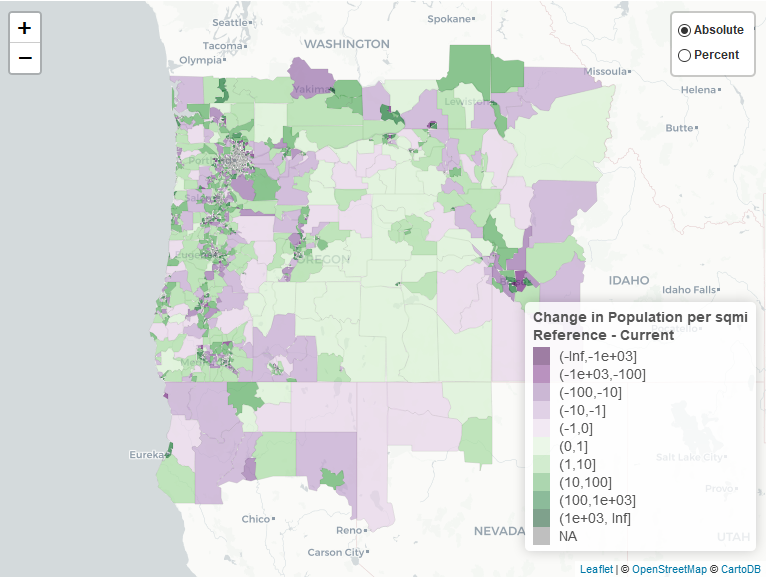
There are also some multiple plot functions that compare the values in more than two scenarios.
The package manual provides full documentation of all the functions and all the options. The package also contains templates for running a quick analysis with multiple plots for one scenario or comparing two scenarios. To access these templates, use RStudio > New > RMarkdown, and then select either the "Reference Scenario" or "Compare Scenarios" template.

After opening the template, the analyst should set the values in the opening chunk to refer to their particular analysis. For example, the following template will compare the Rough Roads reference against the Scenario 1, and will focus its plots on Multnomah, Washington, and Clackamas counties.
# This is the path to the scenario SWIM databases; direct these to your
# local paths.
ref_db <- "J:/swim2/RRA_Reference/outputs/RRA_Reference.db"
cur_db <- "M:/swim2/RRA_Scen1/outputs/RRA_Scen1.db"

# These are the names for the scenarios that will show up in the scenario
# information table and other places.
scenario_names <- c("Reference", "Rough Roads Scen 1")

# Update to reflect scope of analysis.
# If you wish to focus on the Metro and Bend MPOs, for instance, change `facet`
# to "MPO" and facet_levels to `c("Metro", "Bend")`
facet <- "COUNTY"
facet_levels <-  c("Multnomah", "Washington", "Clackamas")

# The tables will only show data from these years.
years <- c(2010, 2025, 2040)

# The leaflet plots show a comparison between the scenarios in a specific year.
# Set this to the year you wish to study. For bridge scenarios, it should be the
# year after the bridge breaks. For others, it should probably be the last year
# version of the simulation.
diff_year <- 2012

MPOs <- c("Bend", "Corvallis", "EugeneSpringfield","Metro", "RougeValley", "NonMPO", "OOO", "SalemKeizer")

# show leaflet plots; FALSE will skip them (saving disk space and time)
use_leaflet <- TRUEThe package is automatically installed with SWIM, as it is included in the
dependencies
zipfile
along with R and all the other R packages. When the zip file is expanded,
swimr is located in root/model/lib/R-3.3.2/library/swimr.
To run swimr as part of a SWIM run, indicate the desired visualizations in
root/scenario/model/config/tsteps.csv with a 1 in one or more of the following
columns: 'SWIMR_reference', 'SWIMR_compare', and 'SWIMR_popemp'. These correspond to
the swimr templates available in RStudio: 'single scenario', 'compare scenario',
and 'population' respectively.
The database locations to be used by swimr are specified in
root/scenario/inputs/globalTemplate.properties, specifically the parameters
viz.final.db (also used by the VIZ module), swimr.reference.db, and
swimr.compare.db.
The output HTML files are saved in the same directory as
the file specified by viz.final.db. This is coded in the file
root/scenario/model/code/viz/swimr_render_rmd.R, which passes parameters
specified in globalTemplate.properties to the Rmd files in the swimr
installation directory.
Additional parameters of the Rmd templates, such as whether to produce
leaflet maps and other parameters, can be changed by altering the values
in the header of the Rmd template file itself. These templates (one for each
of the three outputs described above), are found in the following directories:
root/model/lib/R-3.3.2/library/swimr/rmarkdown/templates/[single_scenario, compare_scenario, population]/skeleton/skeleton.Rmd.