Making Babysteps in R
Goal of this project is to create some fun tables & graphs comparing murderers, weapons, occupations etc. throughout the available Agatha Christie books. Maybe a pattern can be found? Maybe Agatha Christie loved making butlers into murderers? Maybe her books became more bloody over the years? Maybe every third book contains a female murderer that strangels at least 5 people, but only if Hercule Poirot investigates? Answers to these highly important questions can soon be found in this R script. Enjoy!
Main CSV Data taken from https://github.com/JamesJackson1/AgathaChristie. Added columns with Publication Date & Detective. Data is mixed. Some Data concerns the entire book and is then the same for all rows of the book, while some Data is specific to the character the row belongs to.
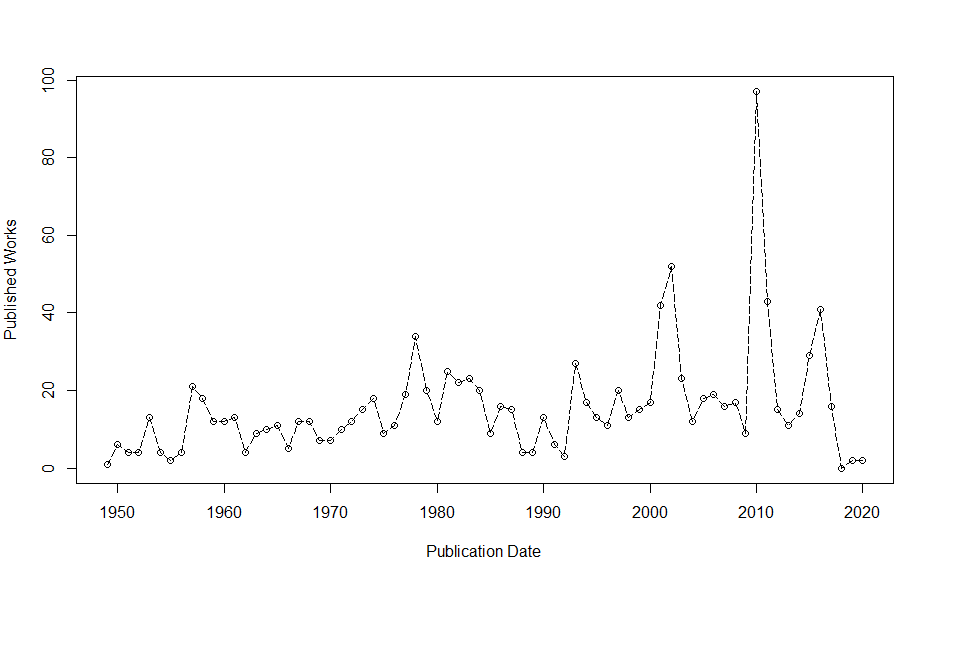
A second Data set was taken from the Books & Editions set from https://www.workwithdata.com/author/agatha-christie-1890, but only used in the last graph, to have more publications available. The difference between the two sets is big.
Difficulties so far are connected to the dataset not containing all books and containing Data concerning different levels, as described above. Some of these difficulties have been resolved in this script, if it was necessary for the plots. If you use this set/script for your own projects, check out the dataframes before using them.
Created for the Course "Datenanalyse mit R" - Sommersemester 2022, taught by Dr. Jürgen Hermes at the University of Cologne
Some Results so far:
Cause of death:

Development of killers / killed over publication years:

Characters in Occupation being killers or not:

same as bubble plot:

same as scatter plot:

Amount killed by each gender in all books:

Murders and weapon through the years by franchise (some overlap):

publications per year (based on 2nd data set):