A futuristic prototype dashboard for managing a fleet of smart vending machines across Iceland. Built with Next.js 16, React 19, TypeScript, Tailwind CSS v4, shadcn/ui, Recharts, TanStack Table, TanStack Query, and Framer Motion.
- Quick Start
- Project Overview
- Tech Stack Explained
- Architecture
- Folder Structure
- Dashboard Sections
- Data Simulation
- Key Patterns & Concepts
- Deployment
- Troubleshooting
- Learning Resources
# 1. Install dependencies
npm install

# 2. Start the development server
npm run dev

# 3. Open in your browser
#    → http://localhost:3000
That's it! No environment variables, API keys, or databases needed. The dashboard runs entirely in the browser using simulated data.
Vendral is a fictional IoT fleet management system for vending machines in Iceland. This dashboard is a fully self-contained prototype that simulates:
- 20 vending machines across 5 Icelandic locations
- 50 products with realistic pricing in ISK (Icelandic Króna)
- Live transactions (card payments) generated every 2–4 seconds
- Hardware events (motor jams, connectivity, temperature) every 5–10 seconds
- Stock depletion that triggers low-stock and out-of-stock alerts
All payments are simulated as card transactions (no cash).
If you're new to any of these technologies, here's what each one does:
The React framework that handles routing, server-side rendering, and building.
- We use the App Router (the
src/app/directory). layout.tsxwraps every page;page.tsxis the main route."use client"directive marks components that need browser APIs (hooks, events).
JavaScript with types. Every variable, function parameter, and return value
has a declared type. This catches bugs at compile time instead of runtime.
Look for interface and type keywords in the code.
A utility-first CSS framework. Instead of writing CSS classes like .card,
you compose styles directly: className="bg-white/5 rounded-lg p-4 border".
Tailwind v4 uses CSS-native config (in globals.css) instead of tailwind.config.js.
A collection of copy-paste React components (Button, Badge, Progress, Tooltip, etc.)
built on Radix UI primitives. They live in src/components/ui/ and are fully customizable.
A charting library for React. We use it for area charts, and the concepts apply to bar charts, line charts, pie charts, etc. Key components:
<ResponsiveContainer>→ auto-sizes the chart to its parent<AreaChart data={...}>→ the chart type<Area>,<XAxis>,<YAxis>,<Tooltip>→ composable building blocks
A headless table library. "Headless" means it provides the logic (sorting,
filtering, pagination) but zero UI — you bring your own markup and styling.
See src/components/transaction-table.tsx for a full working example.
A data-fetching & caching library. It manages loading states, caching,
background refetching, and error handling. Key hook: useQuery({ queryKey, queryFn }).
See src/lib/queries.ts for our custom hooks and src/components/settings-page.tsx
for a live demo comparing TanStack Query vs React Context.
An animation library for React. We use it for:
- Page transitions (
AnimatePresence+motion.divinpage.tsx) - List animations (event ticker items sliding in)
- Hover/tap effects (planogram slot scaling)
An icon library with 1000+ clean SVG icons. Usage: <Monitor className="w-4 h-4" />.
┌──────────────────────────────────────────────────┐
│                Browser (Client)                   │
│                                                   │
│  ┌─────────────────────────────────────────────┐ │
│  │     ClientProviders (client-providers.tsx)    │ │
│  │  ┌──────────────────────────────────────┐   │ │
│  │  │   QueryClientProvider (TanStack Q)   │   │ │
│  │  │  ┌───────────────────────────────┐  │   │ │
│  │  │  │  SimulationProvider (Context)  │  │   │ │
│  │  │  │  ┌──────────┐ ┌───────────┐  │  │   │ │
│  │  │  │  │Simulation│→│  Context   │  │  │   │ │
│  │  │  │  │ Engine   │ │  (State)   │  │  │   │ │
│  │  │  │  └──────────┘ └─────┬─────┘  │  │   │ │
│  │  │  │                     │         │  │   │ │
│  │  │  │    ┌────────────────┴───┐     │  │   │ │
│  │  │  │    │  Dashboard Pages   │     │  │   │ │
│  │  │  │    │  (Overview, Sales, │     │  │   │ │
│  │  │  │    │   Map, Planogram)  │     │  │   │ │
│  │  │  │    └────────────────────┘     │  │   │ │
│  │  │  └───────────────────────────────┘  │   │ │
│  │  └──────────────────────────────────────┘   │ │
│  └─────────────────────────────────────────────┘ │
└──────────────────────────────────────────────────┘
Data flow:
simulation.tsruns intervals that generate transactions + eventssimulation-context.tsxwraps the data in React Context (1-second tick)- Components call
useSimulation()to read machines, transactions, events - Alternatively, components can use TanStack Query hooks from
queries.ts
src/
├── app/                          # Next.js App Router
│   ├── globals.css               # Tailwind v4 theme + glassmorphism utilities
│   ├── layout.tsx                # Root layout (fonts, providers)
│   └── page.tsx                  # Main dashboard shell (sidebar + tabs)
│
├── components/                   # React components
│   ├── ui/                       # shadcn/ui primitives (Button, Badge, etc.)
│   ├── client-providers.tsx      # Client-side providers (Query + Simulation + Tooltip)
│   ├── sidebar.tsx               # Collapsible navigation sidebar
│   ├── stats-ribbon.tsx          # Top KPI ribbon (Revenue, Machines, Alerts)
│   ├── overview-dashboard.tsx    # Bento-box overview (fleet health, map, charts)
│   ├── fleet-health-bar.tsx      # Stacked bar: online/warning/error/offline
│   ├── event-ticker.tsx          # Live scrolling event feed
│   ├── geo-map.tsx               # SVG map of Iceland with cluster pins
│   ├── device-health.tsx         # Machine drill-down (3D kiosk, hardware stack, terminal)
│   ├── sales-dashboard.tsx       # Sales analytics (charts, heatmap, products)
│   ├── transaction-table.tsx     # TanStack Table: sortable/filterable TX log
│   ├── map-view.tsx              # Full map page with search + machine list
│   ├── planogram-view.tsx        # Virtual planogram grid with restock optimizer
│   └── settings-page.tsx         # Settings + TanStack Query demo
│
├── lib/                          # Shared utilities and data
│   ├── data.ts                   # Types, product catalog, machine generator
│   ├── simulation.ts             # Singleton simulation engine
│   ├── simulation-context.tsx    # React Context provider
│   ├── queries.ts                # TanStack Query hooks
│   └── utils.ts                  # cn() utility (clsx + tailwind-merge)
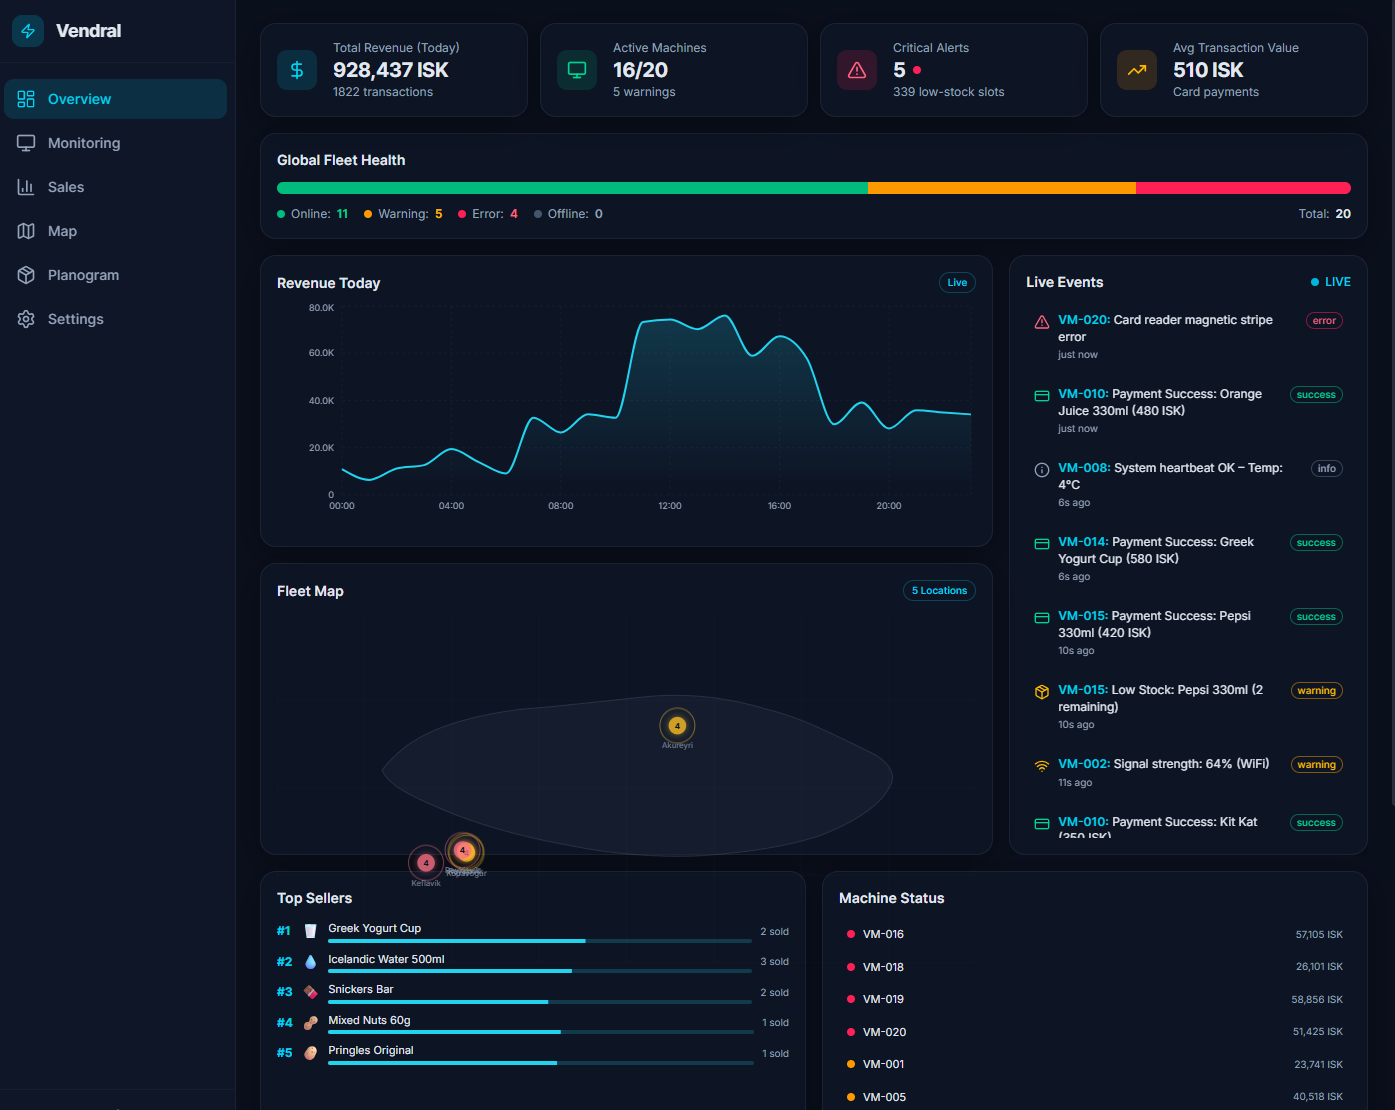
- Fleet Health Bar: Stacked horizontal bar showing machine status proportions
- Mini Revenue Chart: 24-hour area chart (Recharts)
- Event Ticker: Live feed of transactions and system events
- SVG Map: Iceland with color-coded location clusters
- Top Products: Best sellers with stock bars
- Machine Status: Quick list sorted by urgency
- Machine Picker: Grid of all 20 machines to select from
- 3D Kiosk SVG: Visual representation of the selected machine
- Hardware Stack: 6-component status list (bill validator, card reader, temp, etc.)
- Terminal Log: Monospace event log with timestamps and error codes
- KPI Tiles: Revenue, MTD, ATV, Conversion Rate with trend arrows
- Dual-Axis Area Chart: Revenue (ISK) vs Foot Traffic overlaid
- Sales Heatmap: Hour × Day-of-week grid (cyan intensity = sales volume)
- Top/Bottom Products: Best and worst sellers with stock indicators
- Transaction Table: Sortable, searchable table (TanStack Table)
- Full SVG Map: Larger map with connection lines between locations
- Search Bar: Filter machines by ID, name, or city
- Location Chips: Quick filter by location
- Machine Cards: Detailed status with glow indicators and quick actions
- 10×6 Grid: 60 slots with product icons, prices, stock bars
- Color Coding: 🔴 Empty, 🟠 Low (≤2), 🔵 Adequate (3+)
- Restock Optimizer: Toggle to highlight and pulse slots needing refill
- Restock Summary: Priority list grouped by product
- System info cards
- TanStack Query Demo: Live comparison of Context vs Query data fetching
The simulation runs entirely in the browser (no server needed):
| Parameter | Value |
|---|---|
| Products | 50 (ISK 300-2,000, weights 1-3) |
| Machines | 20 (4 per location) |
| Locations | 5 (Reykjavik, Kopavogur, Akureyri, Keflavik) |
| Transaction rate | Every 2-4 seconds |
| Event rate | Every 5-10 seconds |
| Payment method | Card only (all transactions) |
| Currency | ISK (Icelandic Krona) |
| Planogram | 10 rows x 6 columns = 60 slots |
Products have a weight property (1–3). Popular items like Coca-Cola (weight 3)
are 3× more likely to be "sold" than niche items like Açaí Bowl (weight 1).
See weightedRandomProduct() in src/lib/data.ts.
The dark theme uses semi-transparent backgrounds with backdrop blur:
.glass-card {
  background: rgba(15, 23, 42, 0.6);
  backdrop-filter: blur(12px);
  border: 1px solid rgba(148, 163, 184, 0.1);
}layout.tsx is a Server Component, but providers need client features.
Solution: wrap providers in a "use client" component (client-providers.tsx).
Instead of useEffect(() => setState(prop), [prop]) (which causes cascading renders),
we use useMemo or direct computation to derive state from props.
See device-health.tsx and planogram-view.tsx.
TanStack Table separates logic from UI. You define columns with ColumnDef,
create a table instance with useReactTable(), then render with flexRender().
See transaction-table.tsx for a complete annotated example.
Every useQuery call specifies a queryKey (cache key) and queryFn (data fetcher).
Multiple components using the same key share one cached response.
See src/lib/queries.ts for all hooks.
Vercel is the company behind Next.js and offers the smoothest deployment:
# 1. Install Vercel CLI
npm install -g vercel

# 2. Deploy (follow the prompts)
vercel

# 3. For production deployment
vercel --prod
Or use the Vercel Dashboard:
- Push your code to GitHub / GitLab / Bitbucket
- Go to vercel.com → New Project → Import your repo
- Vercel auto-detects Next.js and deploys automatically
Since this dashboard is entirely client-side, you can export it as static HTML:
# 1. Add output: 'export' to next.config.ts (see below)
# 2. Build the static export
npm run build
# 3. The output is in the `out/` folder
#    Upload to Netlify, Cloudflare Pages, GitHub Pages, S3, etc.
To enable static export, update next.config.ts:
const nextConfig = {
  output: 'export',
  images: { unoptimized: true },
};
export default nextConfig;FROM node:20-alpine AS builder
WORKDIR /app
COPY package*.json ./
RUN npm ci
COPY . .
RUN npm run build
FROM node:20-alpine AS runner
WORKDIR /app
COPY --from=builder /app/.next/standalone ./
COPY --from=builder /app/.next/static ./.next/static
COPY --from=builder /app/public ./public
EXPOSE 3000
CMD ["node", "server.js"]For the standalone Docker output, add to next.config.ts:
const nextConfig = { output: 'standalone' };Then build and run:
docker build -t vendral .
docker run -p 3000:3000 vendral# Build for production
npm run build
# Start the production server (port 3000)
npm startThe width(-1) and height(-1) of chart should be greater than 0
This is harmless — it happens during static page generation when there's no real DOM to measure. The charts work perfectly in the browser.
If VS Code shows red squiggles on imports but npm run build succeeds:
- Restart TypeScript:
Ctrl+Shift+P→ "TypeScript: Restart TS Server" - Rebuild:
npm run buildto regenerate type definitions
# Windows PowerShell: find and kill the process
netstat -ano | findstr :3000
taskkill /PID <PID_NUMBER> /F

# Or just use a different port
npm run dev -- --port 3001- Next.js Docs — Official documentation
- Learn Next.js — Interactive tutorial
- TypeScript Handbook — Official guide
- Total TypeScript — Free beginner tutorials
- Tailwind Docs — Class reference
- Tailwind v4 Guide — What changed in v4
- shadcn/ui Docs — Component examples and installation
- Recharts API — Component reference
- Recharts Examples — Visual gallery
- TanStack Table Docs — Official docs
- TanStack Table Examples — React examples
- TanStack Query Docs — Official docs
- Practical React Query — Excellent blog series
- Framer Motion Docs — API reference
This is a prototype / educational project. Use it however you like.
Built with ❄️ in Iceland