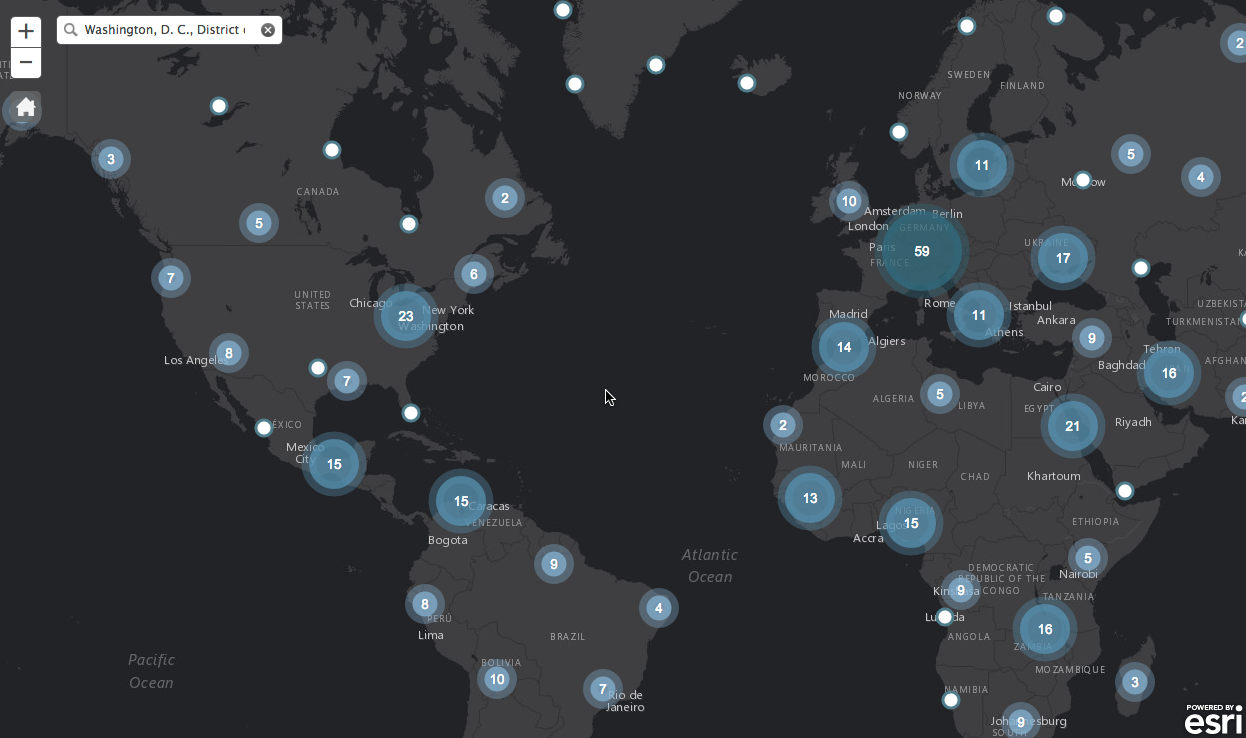
An easy way to cluster 1000s of features for any point feature service. Set the styles, sizes and density to best fit your data.
- Auto cluster features
- Set styles, colors, sizes and density
- Format Infowindow for clusters and singles
- Compatible with bootstrap and bootstrap-map-js
// Create a cluster layer for a point feature service

clusterLayer = new ClusterFeatureLayer({
    "url": "http://services.arcgis.com/oKgs2tbjK6zwTdvi/arcgis/rest/services/Major_World_Cities/FeatureServer/0",
    "distance": 75,
    "id": "clusters",
    "labelColor": "#fff",
    "resolution": map.extent.getWidth() / map.width,
    "singleTemplate": infoTemplate,
    "useDefaultSymbol": false,
    "zoomOnClick": true,
    "showSingles": true,
    "objectIdField": "FID",
    outFields: ["NAME", "COUNTRY", "POPULATION", "CAPITAL"]
});

map.addLayer(clusterLayer);- Be sure to set the distance (pixels), the size will depend on the size of your styled clusters
- By default it pulls 1000 features at time
- You can also set the max features to cluster, it can process 100,000 in about 8-10s
- Here are the constructor options (more work needs to be done here to set better defaults)
	// options:
    //     url:    string
    //        URL string. Required. Will generate clusters based on Features returned from map service.
    //     outFields:    Array?
    //        Optional. Defines what fields are returned with Features.
    //     objectIdField:    String?
    //        Optional. Defines the OBJECTID field of service. Default is 'OBJECTID'.
    //     where:    String?
    //        Optional. Where clause for query.
    //     useDefaultSymbol:    Boolean?
    //        Optional. Use the services default symbology for single features.
    //     returnLimit:    Number?
    //        Optional. Return limit of features returned from query. Default is 1000.
    //     distance:    Number?
    //         Optional. The max number of pixels between points to group points in the same cluster. Default value is 50.
    //     labelColor:    String?
    //         Optional. Hex string or array of rgba values used as the color for cluster labels. Default value is #fff (white).
    //     labelOffset:    String?
    //         Optional. Number of pixels to shift a cluster label vertically. Defaults to -5 to align labels with circle symbols. Does not work in IE.
    //     resolution:    Number
    //         Required. Width of a pixel in map coordinates. Example of how to calculate:
    //         map.extent.getWidth() / map.width
    //     showSingles:    Boolean?
    //         Optional. Whether or graphics should be displayed when a cluster graphic is clicked. Default is true.
    //     zoomOnClick:    Boolean?
    //         Optional. Will zoom the map when a cluster graphic is clicked. Default is true.
    //     singleSymbol:    MarkerSymbol?
    //         Marker Symbol (picture or simple). Optional. Symbol to use for graphics that represent single points. Default is a small gray SimpleMarkerSymbol.
    //     singleRenderer:    Renderer?
    //         Optional. Can provide a renderer for single features to override the default renderer.
    //     singleTemplate:    PopupTemplate?
    //         PopupTemplate. Optional. Popup template used to format attributes for graphics that represent single points. Default shows all attributes as 'attribute = value' (not recommended).
    //     disablePopup:    Boolean?
    //         Optional. Disable infoWindow for cluster layer. Default is false.
    //     maxSingles:    Number?
    //         Optional. Threshold for whether or not to show graphics for points in a cluster. Default is 1000.
    //     font:    TextSymbol?
    //         Optional. Font to use for TextSymbol. Default is 10pt, Arial.
    //     spatialReference:    SpatialReference?
// Optional. Spatial reference for all graphics in the layer. This has to match the spatial reference of the map. Default is 102100. Omit this if the map uses basemaps in web mercator.- The core code was borrowed from the ArcGIS sample but much of it was re-written
- Odoe also contributed as well
Anyone and everyone is welcome to contribute. Please see our guidelines for contributing.
Copyright 2015 Esri
Licensed under the Apache License, Version 2.0 (the "License"); you may not use this file except in compliance with the License. You may obtain a copy of the License at
http://www.apache.org/licenses/LICENSE-2.0
Unless required by applicable law or agreed to in writing, software distributed under the License is distributed on an "AS IS" BASIS, WITHOUT WARRANTIES OR CONDITIONS OF ANY KIND, either express or implied. See the License for the specific language governing permissions and limitations under the License.
A copy of the license is available in the repository's license.txt file.
[](Esri Tags: ArcGIS Web Mapping Bootstrap Cluster Points) [](Esri Language: JavaScript)
