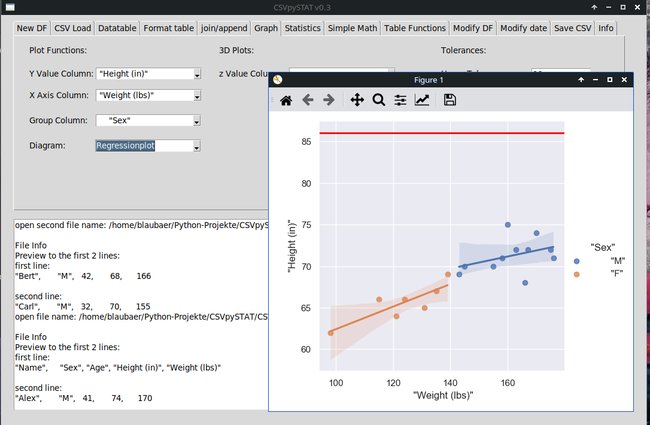
Graph
Choose Data Columns and Graph.
The following Graph are possible:
- Time Series Plot
- Boxplot
- Violin Plot
- Individual Plot
- Scatter Plot
- Regression Plot
- Count Plot
- Bar Plot
- Pie Plot
- Pareto Plot
- 3d Scatter Plot
Choose Data Columns and Graph.
The following Graph are possible: