Common functions for plotting results of epigenome-wide association studies (EWAS) implemented in R and based on ggplot2.
To install EWAS plot:
devtools::install_github("annebozack/EWASplot")
library(EWASplot)
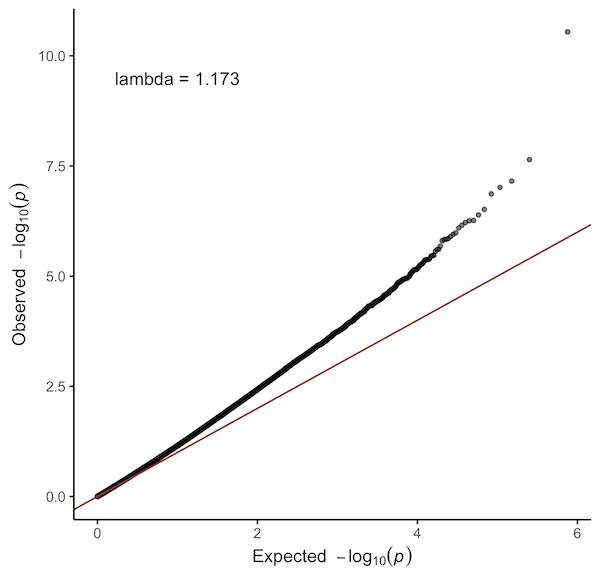
Quantile-quantile plot of observed and expected p-values. Genomic inflation factor (λ) is calculated using the median method.
qq_plot(probes$P.Value)
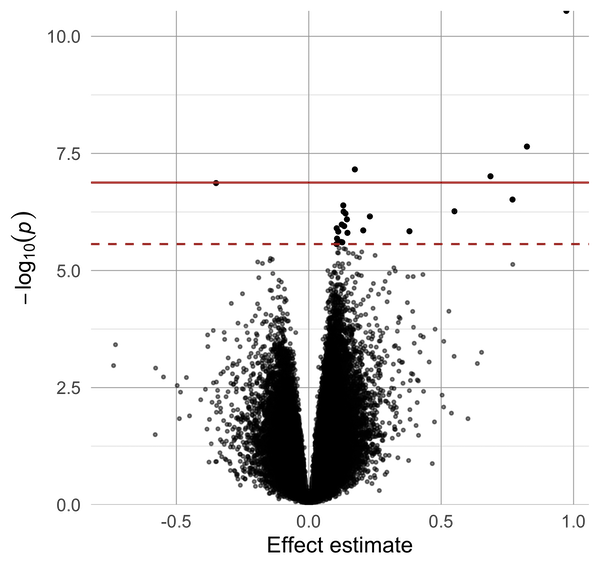
Volcano plot of effect estimates and p-values. Aesthetics including point size and color can be modified.
volcano_plot(probes$P.Value, probes$logFC, FDR = T)
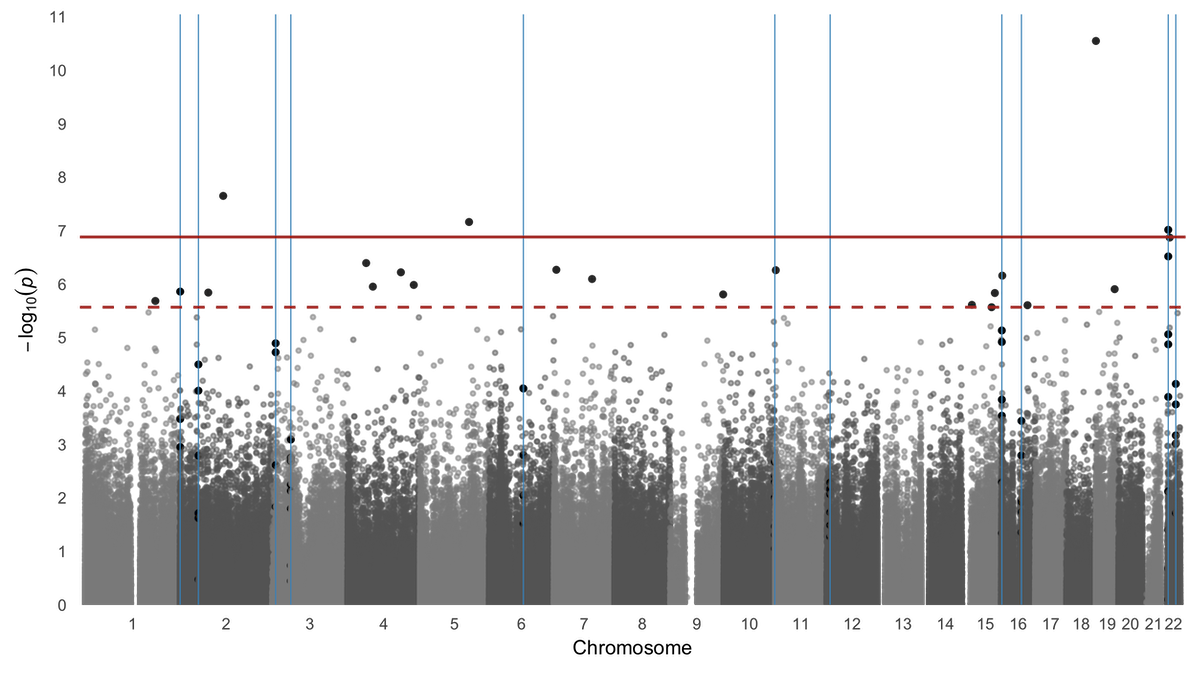
Manhattan plot of p-values and genomic locations. If results from 450K or EPIC analyses are provided with genomic locations, probes will be annotated using Bioconductor annotation packages. The locations of regions can also be plotted by providing a region argument. Aesthetics including point size and color can be modified.
If probes are to be annotated, please be sure the correct annotation package is installed, e.g.:
BiocManager::install("IlluminaHumanMethylation450kanno.ilmn12.hg19")
BiocManager::install("IlluminaHumanMethylationEPICanno.ilm10b4.hg19")
manhattan_plot(probes, regions, FDR = T)
Plots in examples are from:
Bozack AK, Boileau P, Wei L, et al. 2021. Exposure to arsenic at different life-stages and DNA methylation meta-analysis in buccal cells and leukocytes. Environ Health. 2021 Jul 9;20(1):79. doi: 10.1186/s12940-021-00754-7. PMID: 34243768