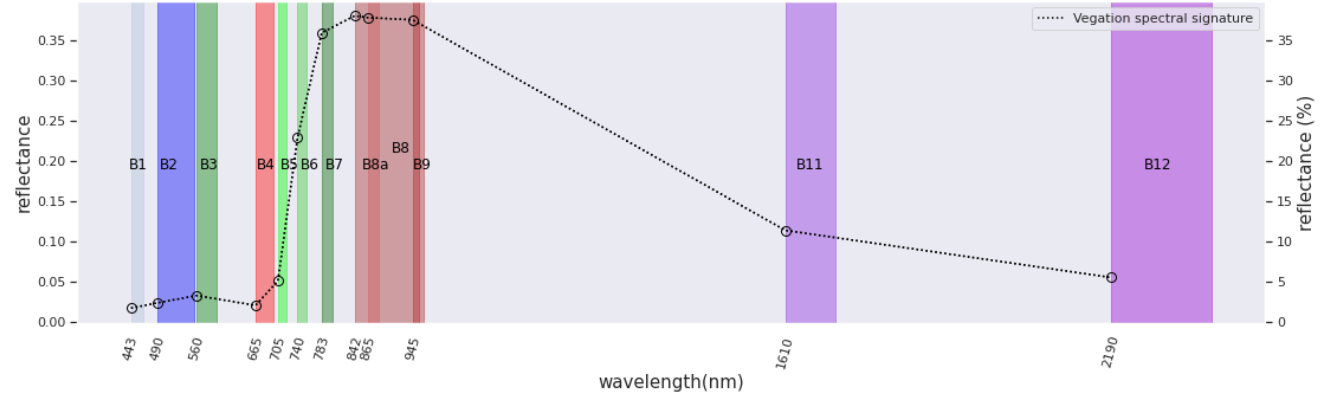
This repository contains a function for creating a nice plot of a feature's spectral signature (e.g vegetation, urban area) from Sentinel-2 data
git clone https://github.com/IoannisGkanatsios/Spectral_signature_plot.git
cd Spectral_signature_plot
The spectral_signature_plot function takes two arguments:
- 1st argument: The path to the sentinel-2 (.tif) image should be provided
- 2nd argument: Provide the coordinates (of a single point) over a feature from which the spectral signature will be produced. The coordinates should be given in brackets (x, y) and its coordinate system should match the one of the sentinel-2 data