Skip to content

Display live graphs of activity counts on screen #2

@wumbor

Description

@wumbor

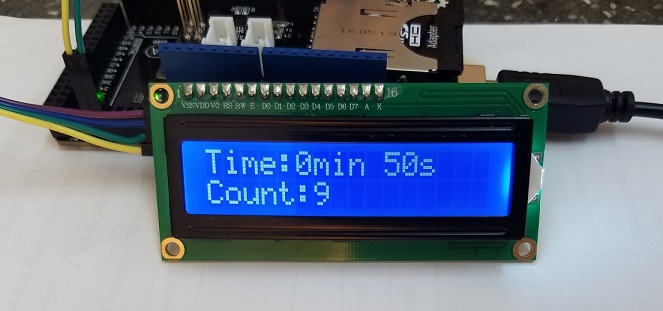
Currently, the results from Actifield are displayed on an LCD screen.
Figure 17

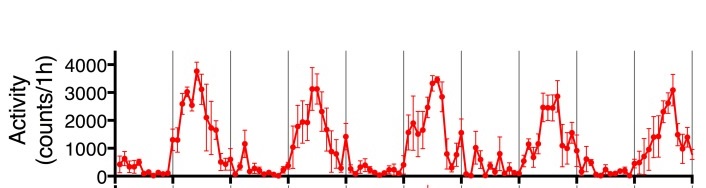
However, a live graphical display of the counts (y-axis) across time (x-axis) will be more intuitive. A graph that looks like this.
actigraph

I came across this RealTime Plotter using Processing. Something like this might work.

Metadata

Metadata

Assignees

No one assigned

    Labels

    mozsprintFor the Mozilla Sprint for Internet Health 2019processingSkills in Processing programming will be useful herepythonSkills in Python programming will be useful here

    Type

    No type

    Projects

    No projects

    Milestone

    No milestone

    Relationships

    None yet

    Development

    No branches or pull requests

    Issue actions