A problem that pops up repeatedly in different contexts is that we may want to adjust certain scale parameters without explicitly calling a scale function. We already have some support for this, e.g. with xlim() to set limits on the x position scale or xlab() to set its title, but there are numerous other scenarios where the same problem arises. Here are some examples:
It would be good if we could come up with a generic approach to these issues. I note that xlim() and xlab() use entirely different implementation approaches currently, so that's not promising:
-
xlim() and ylim() use the ggplot2:::limits() function to automatically generate a scale function and give it the appropriate parameter settings:
|
limits <- function(lims, var) UseMethod("limits") |
|
#' @export |
|
limits.numeric <- function(lims, var) { |
|
if (length(lims) != 2) { |
|
abort("`lims` must be a two-element vector") |
|
} |
|
if (!any(is.na(lims)) && lims[1] > lims[2]) { |
|
trans <- "reverse" |
|
} else { |
|
trans <- "identity" |
|
} |
|
|
|
make_scale("continuous", var, limits = lims, trans = trans) |
|
} |
|
|
|
make_scale <- function(type, var, ...) { |
|
scale <- match.fun(paste("scale_", var, "_", type, sep = "")) |
|
scale(...) |
|
} |
|
|
|
#' @export |
|
limits.character <- function(lims, var) { |
|
make_scale("discrete", var, limits = lims) |
|
} |
|
#' @export |
|
limits.factor <- function(lims, var) { |
|
make_scale("discrete", var, limits = as.character(lims)) |
|
} |
|
#' @export |
|
limits.Date <- function(lims, var) { |
|
if (length(lims) != 2) { |
|
abort("`lims` must be a two-element vector") |
|
} |
|
make_scale("date", var, limits = lims) |
|
} |
|
#' @export |
|
limits.POSIXct <- function(lims, var) { |
|
if (length(lims) != 2) { |
|
abort("`lims` must be a two-element vector") |
|
} |
|
make_scale("datetime", var, limits = lims) |
|
} |
|
#' @export |
|
limits.POSIXlt <- function(lims, var) { |
|
if (length(lims) != 2) { |
|
abort("`lims` must be a two-element vector") |
|
} |
|
make_scale("datetime", var, limits = as.POSIXct(lims)) |
|
} |
-
xlab() and ylab() ultimately feed their info to the update_labels() function, which writes to a special plot$labels field that the layout reads from:
|
update_labels <- function(p, labels) { |
|
p <- plot_clone(p) |
|
p$labels <- defaults(labels, p$labels) |
|
p |
|
} |
|
plot_table <- layout$render(geom_grobs, data, theme, plot$labels) |
|
labels <- self$coord$labels( |
|
list( |
|
x = self$xlabel(labels), |
|
y = self$ylabel(labels) |
|
), |
|
self$panel_params[[1]] |
|
) |
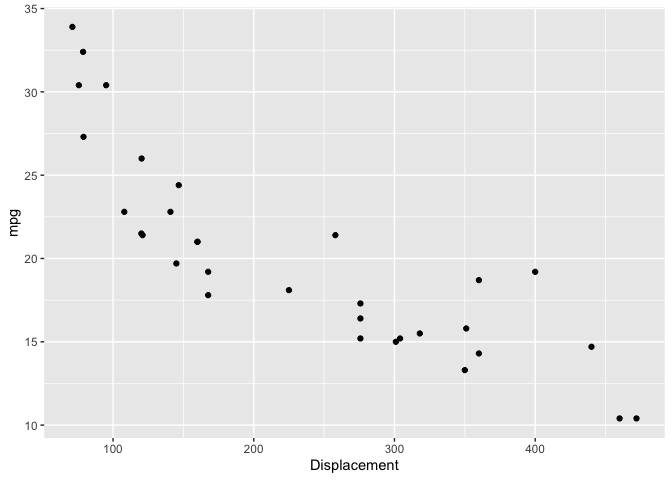
Neither approach generalizes directly to the other use cases. I also have concerns about the way xlim() and ylim() are implemented, because the fact that they add explicit scales functions is not obvious and can lead to strange behavior. See e.g. the following reprex, where in the first plot the call to scale_x_continuous() overwrites the xlim() call but in the second plot the xlab() call is not overwritten:
library(ggplot2)

ggplot(mtcars, aes(disp, mpg)) +
  geom_point() +
  xlim(100, 300) +
  scale_x_continuous(name = "Displacement")
#> Scale for 'x' is already present. Adding another scale for 'x', which will
#> replace the existing scale.
ggplot(mtcars, aes(disp, mpg)) +
  geom_point() +
  xlab("Displacement") +
  scale_x_continuous(limits = c(100, 300))
#> Warning: Removed 16 rows containing missing values (geom_point).
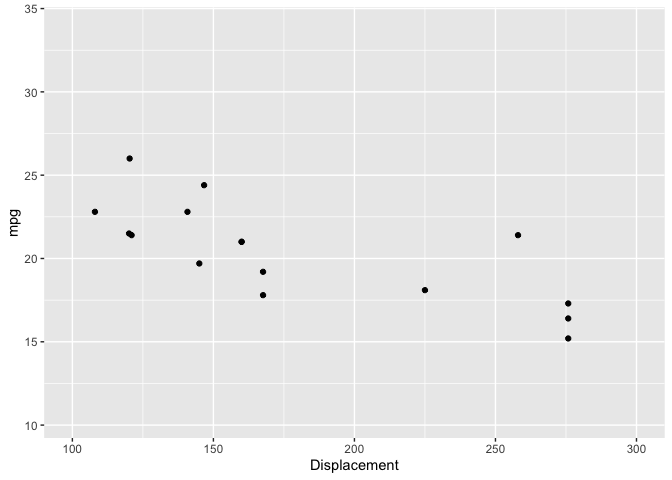
Created on 2020-11-17 by the reprex package (v0.3.0)
A problem that pops up repeatedly in different contexts is that we may want to adjust certain scale parameters without explicitly calling a scale function. We already have some support for this, e.g. with
xlim()to set limits on the x position scale orxlab()to set its title, but there are numerous other scenarios where the same problem arises. Here are some examples:scale_y_continuous(expand = expansion(c(0, 0.05))#3962drop = FALSEon discrete scales: Inconsistent colours in filled contour plot #4268 (comment)It would be good if we could come up with a generic approach to these issues. I note that
xlim()andxlab()use entirely different implementation approaches currently, so that's not promising:xlim()andylim()use theggplot2:::limits()function to automatically generate a scale function and give it the appropriate parameter settings:ggplot2/R/limits.r
Lines 112 to 160 in 3be0acc
xlab()andylab()ultimately feed their info to theupdate_labels()function, which writes to a specialplot$labelsfield that the layout reads from:ggplot2/R/labels.r
Lines 13 to 17 in 3aa2937
ggplot2/R/plot-build.r
Line 170 in 660aad2
ggplot2/R/layout.R
Lines 107 to 113 in b76fa96
Neither approach generalizes directly to the other use cases. I also have concerns about the way
xlim()andylim()are implemented, because the fact that they add explicit scales functions is not obvious and can lead to strange behavior. See e.g. the following reprex, where in the first plot the call toscale_x_continuous()overwrites thexlim()call but in the second plot thexlab()call is not overwritten:Created on 2020-11-17 by the reprex package (v0.3.0)