perf-sentinel ships an interactive terminal UI for exploring
findings, span trees and cross-trace correlations. It exposes three
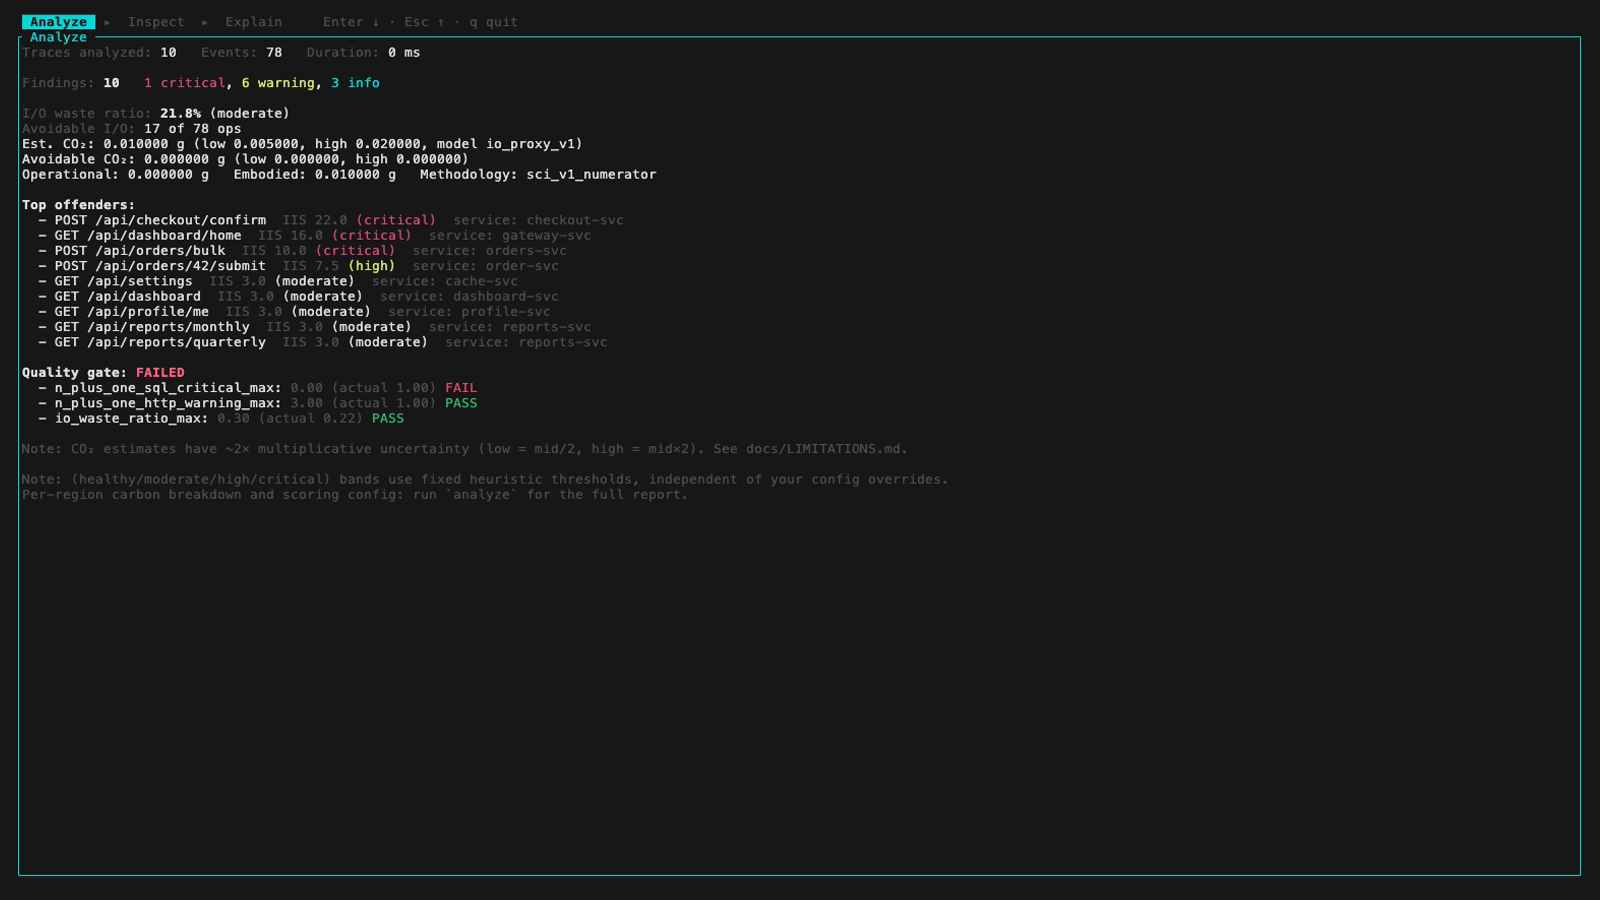
views as a single drill-down: Analyze (the summary dashboard),
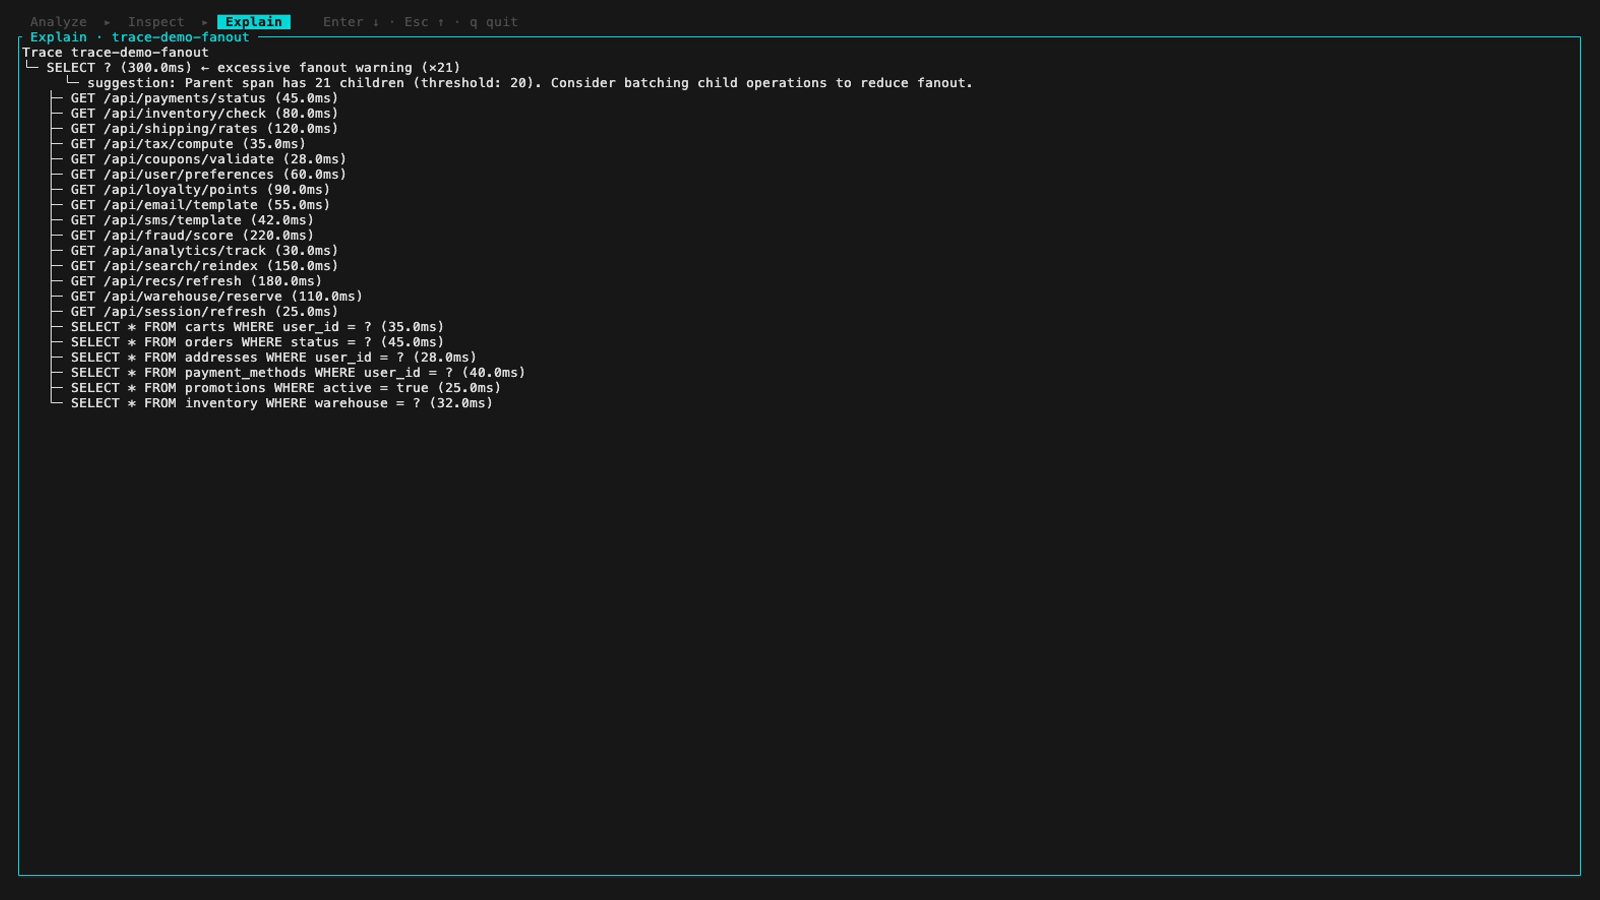
Inspect (the multi-panel browser) and Explain (one trace's
full-screen span tree). Whichever entry point you use, you move between
the three views without leaving the TUI.
Entry points:
perf-sentinel analyze --tui [--input <events.json>]: opens on the Analyze view.perf-sentinel inspect --input <events.json>: opens on the Inspect view, reads a raw events file or a pre-computed Report JSON.perf-sentinel explain --tui --trace-id <id> --input <events.json>: opens on the Explain view, focused on that trace.perf-sentinel query --daemon <URL> inspect: live mode, opens on Inspect, reads findings and traces from a running daemon over HTTP.
In live mode (0.5.24+), the TUI also lets the operator acknowledge and revoke findings interactively from the terminal.
This TUI is the developer's trace and finding browser. For deployment
monitoring there is a separate live operator TUI,
perf-sentinel query monitor (since 0.8.8): five tabs cycled with
Tab, Advisor (the daemon's settings-advisor hints), Energy
(the effective energy/carbon mix per service and per region),
Trends (live braille charts of the energy/carbon per window and of
the runtime gauges as a share of their configured caps), Scrapers
(live health of the energy backends from /api/energy) and Config
(the read-only daemon parameters with their defaults and a one-line
explanation each), auto-refreshed from the daemon every --refresh
seconds (default 5).
When the daemon becomes unreachable, the last good snapshot stays on
screen with a stale indicator. Read-only: no acknowledgments, no API
key needed.

The three views form one drill-down. Enter descends, Esc ascends:
Analyze  --Enter-->  Inspect  --Enter-->  Explain
         <---Esc---           <---Esc---
- Analyze: the scrollable summary (GreenOps waste, top offenders,
quality gate), the same content as
analyzestdout.Enterdescends to Inspect. - Inspect: the multi-panel browser described below.
Enterdrills through the panels and, from Detail, opens Explain.Escwalks back toward Analyze. - Explain: the selected trace's annotated span tree, full screen
and scrollable.
Escreturns to the Inspect Detail panel.
A tab bar at the top highlights the active view. Span trees need raw
spans (inspect --input <events>.json or query inspect). A
pre-computed Report carries none, so Explain shows a hint instead.
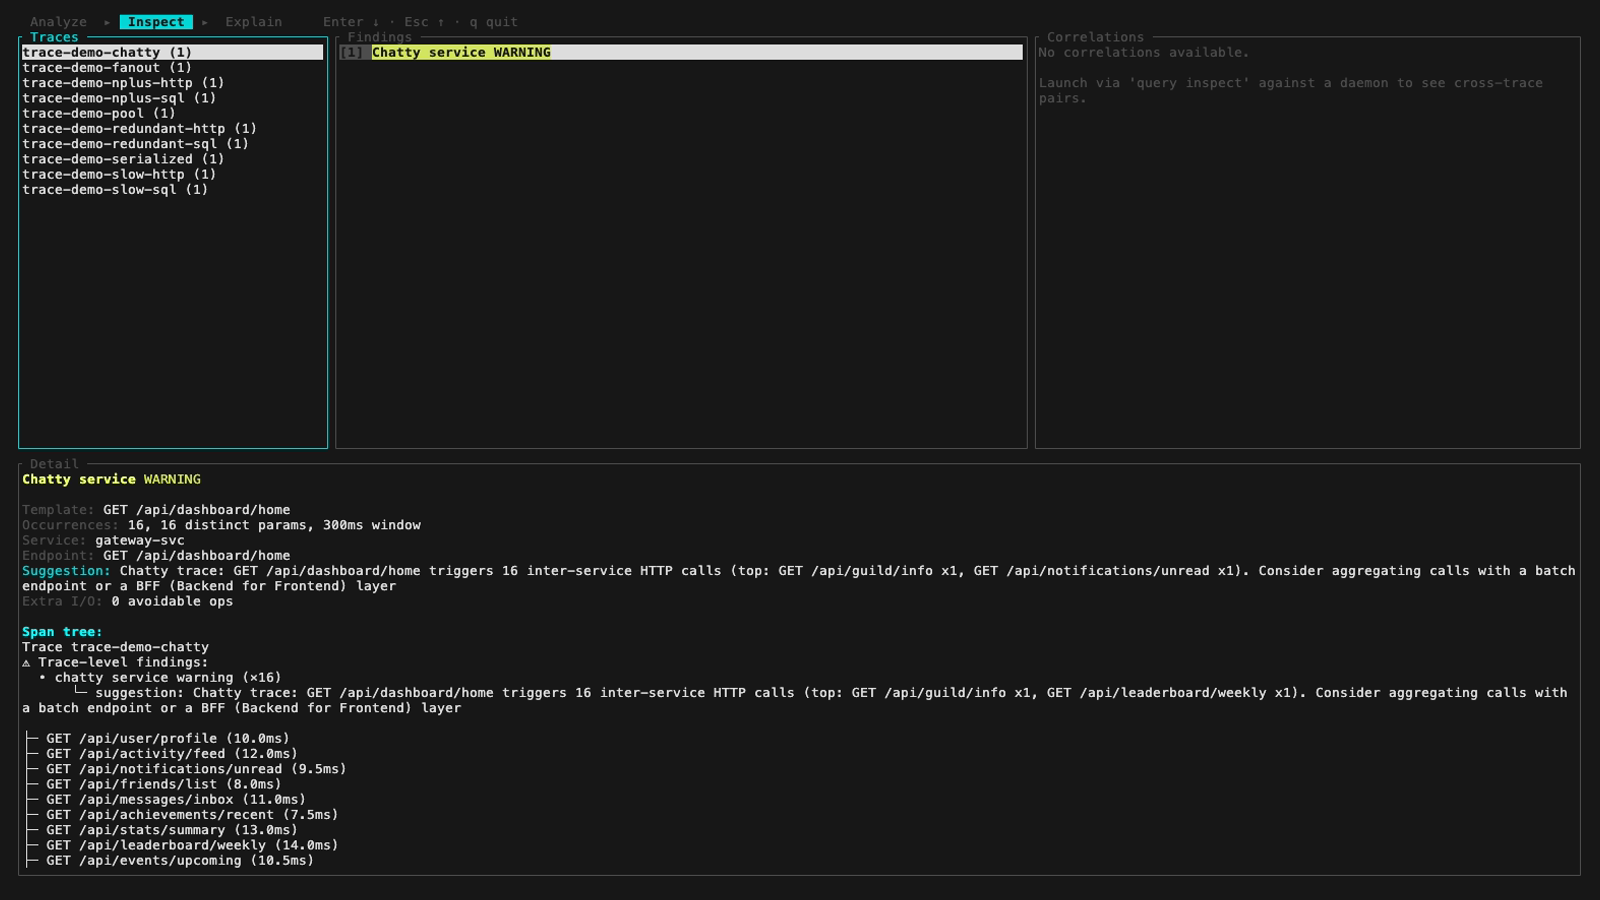
The screen splits into a 2-row layout:
┌─ Traces ──┬─ Findings ────────────────┬─ Correlations ────┐
│ trace-1   │ [1] N+1 SQL CRITICAL      │ svc-a -> svc-b    │
│ trace-2   │ [2] Redundant SQL WARNING │ ...               │
│ ...       │ [3] Slow HTTP INFO        │                   │
├───────────┴───────────────────────────┴───────────────────┤
│ Detail (full-width, span tree + finding metadata)         │
└───────────────────────────────────────────────────────────┘
The active panel border highlights cyan, the rest stays gray.
Navigation works with arrow keys throughout. In the Inspect view the vim
keys h / j / k / l also apply, and j / k scroll the Analyze
and Explain views.
| Key | Action |
|---|---|
q |
Quit |
↑ / k |
Move selection up, or scroll (Analyze, Explain) |
↓ / j |
Move selection down, or scroll (Analyze, Explain) |
→ / Tab / l |
Cycle to next panel (Inspect) |
← / BackTab / h |
Cycle to previous panel (Inspect) |
Enter |
Drill down one step (see below) |
Esc |
Walk back up one step |
m |
Toggle mouse mode to drag-resize panel borders |
r |
Reset panel sizes to their defaults (Inspect) |
a |
Acknowledge the selected finding (live mode) |
u |
Revoke the existing ack (live mode) |
m toggles mouse capture (opt-in, so native terminal selection and
copy-paste stay available while it is off). With it on, drag the border
between two panels to redistribute their space, hovering a border
highlights it with a handle glyph since a terminal application cannot
change the OS mouse pointer. r resets the layout to its defaults. Panel
sizes are per-session and not persisted.
Enter drills down: from Analyze to Inspect, then through the Inspect
panels (Traces, Findings, Detail), then from Detail to Explain. From the
Correlations panel it jumps to the Detail of the correlation's sample
trace. Esc reverses each step, ascending from the top Inspect panels
back to Analyze.
a and u are no-op in batch mode (inspect --input): acknowledgment
requires a running daemon to persist.
When launched via query inspect, the TUI fetches findings with
?include_acked=true so already-acknowledged findings appear in the
list with an italic gray [acked by <user>] indicator at the end of
the line.
Pressing a on a selected finding opens a modal centered on the
screen with three input fields:
| Field | Constraint | Default |
|---|---|---|
| Reason | 1 to 256 chars, single line | empty (required) |
| Expires | empty, 24h, 7d, ISO8601, etc |
empty (no expiration) |
| By | 1 to 128 chars | $USER env var |
Plus two buttons (Submit / Cancel).
Modal navigation:
| Key | Action |
|---|---|
Tab |
Move focus to the next field / button |
BackTab |
Move focus backwards |
Enter (text) |
Advance to the next field |
Enter (Submit) |
Submit the form |
Enter (Cancel) |
Close the modal without submitting |
Esc |
Cancel the modal |
Backspace |
Delete the last char of the focused buffer |
On submit, the TUI posts to /api/findings/<sig>/ack and closes the
modal on 201. On error (4xx/5xx), the modal stays open with the
error message at the bottom (red text).
Pressing u on an acknowledged finding opens a confirmation modal.
Submit / Enter issues a DELETE /api/findings/<sig>/ack.
Cancel / Esc closes without revoking.
Mirrors the CLI ack helper (since 0.5.22):
- Empty: no expiration, ack persists until manually revoked
24h,7d,30m: relative duration parsed by humantime2026-05-11T00:00:00Z: ISO8601 absolute datetime
Invalid input shows expires: <error> in the modal footer without
sending the request.
The TUI mirrors the CLI ack helper's auth resolution:
PERF_SENTINEL_DAEMON_API_KEYenv var (priority 1)--api-key-file <path>flag onquery inspect(priority 2)
# env var
export PERF_SENTINEL_DAEMON_API_KEY=$(cat ~/.config/perf-sentinel/key)
perf-sentinel query --daemon http://localhost:4318 inspect

# file
perf-sentinel query --daemon http://localhost:4318 inspect \
  --api-key-file ~/.config/perf-sentinel/key
Both are equivalent. The file path supports O_NOFOLLOW symlink
refusal on Unix and trims trailing newlines.
No interactive password prompt in the TUI. Raw mode and the
alternate screen are incompatible with rpassword TTY input. If the
daemon answers 401 without an env or file key, the modal shows
"API key required: set PERF_SENTINEL_DAEMON_API_KEY or pass
--api-key-file when launching query inspect." Quit, set the key,
relaunch.
When the daemon has no [daemon.ack] api_key configured (default for
loopback deployments), no key is needed and the modal just submits.
run_loop is synchronous and the daemon ack write is performed via
tokio::runtime::Handle::current().block_on(...) from inside the
loop. The UI freezes for the duration of the request, typically
100-300 ms on localhost, longer over the network. Acceptable for a
scope-minimal release. An async event loop refactor is a candidate
followup if user feedback signals friction.
The findings list is fetched once at boot. a/u refresh only the
ack state via a second GET /api/findings?include_acked=true, the
list of findings itself does not change in-session. To pick up newly
ingested traces, quit and relaunch.
Findings acked in .perf-sentinel-acknowledgments.toml (CI ack)
appear with the [acked by <user>] indicator and the source field
set to toml. The TUI cannot promote a daemon ack to TOML or edit
the TOML file. For permanent acks, edit the file via PR review per
ACK-WORKFLOW.md.
perf-sentinel query monitor (since 0.8.8) is the operator-side
counterpart to the developer's Inspect browser above. It runs against a
live daemon, polls it on a fixed cadence (--refresh seconds, default
5) and is read-only. Tab cycles the five tabs, j/k scroll, q
quits. On the Trends tab, m toggles mouse mode to drag-resize the chart
borders and r resets them, the same affordance as the Inspect browser.
The data each tab surfaces (config hints, source provenance,
per-region intensities) is categorical and high-cardinality, which is
exactly what the bounded-label rule keeps off Prometheus /metrics.

-
Advisor renders the daemon's settings-advisor hints (
warning_details), color-coded by kind. A well-dimensioned daemon reports no hints; the capture below is an undersized one whose trace window is pinned near its cap.
-
Energy shows the effective energy/carbon mix straight from the live
green_summary: per service (effective source, measured share, energy, region) and per region (grid intensity, cold embedded vs hot real-time source).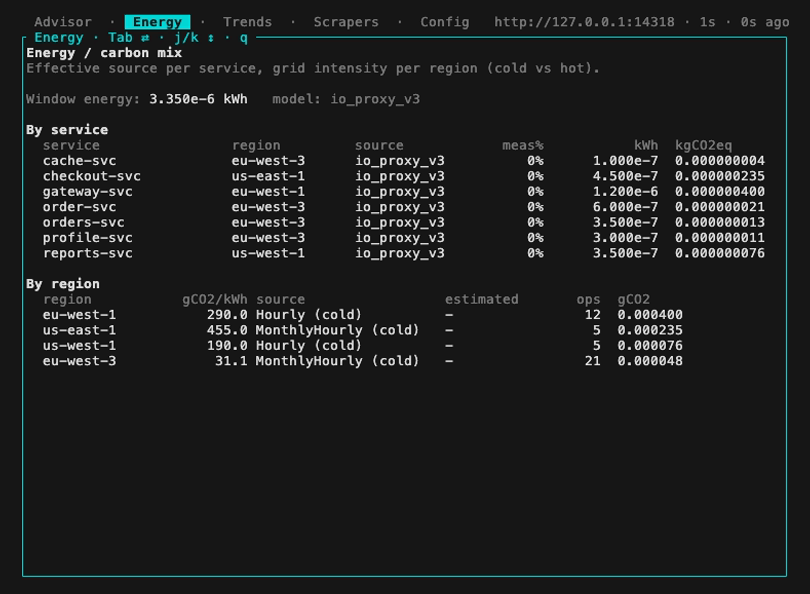
-
Trends plots the poll history as live braille charts: energy and carbon per scoring window on top, and below them the Headroom chart, each runtime gauge (
active_traces,analysis_queue_depth,stored_findings) as a percentage of its configured cap with the settings advisor's 90% threshold drawn in. When the effective grid intensity is static, the two top curves track each other; they diverge when the intensity moves, either from the live Electricity Maps real-time feed or from a shifting regional mix (the capture below stages the latter). One point lands per refresh tick, up to 240 points (20 minutes at the default 5 s), and the history lives in the monitor only: restarting it starts a fresh window. The capacity fields need a 0.8.8 daemon; against an older one the Headroom panel degrades to a hint.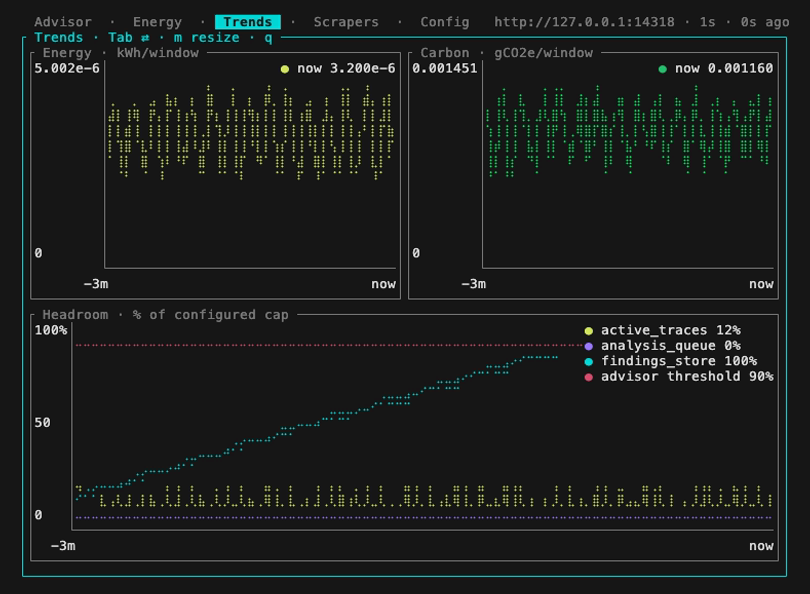
-
Scrapers reads
/api/energyfor live backend health. Herecloud_energyis configured but its endpoint is unreachable, so its freshness age climbs while the unconfigured backends stay dashed.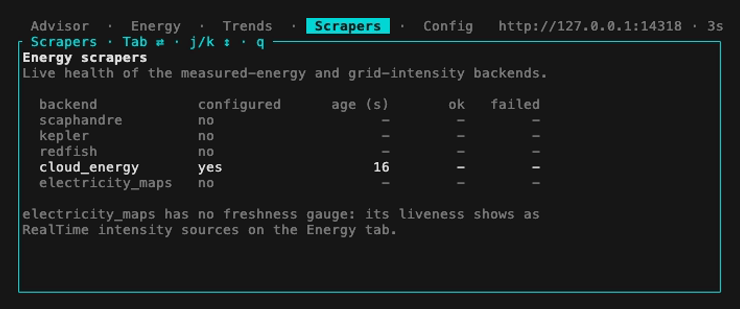
-
Config reads
/api/configfor the daemon's effective[daemon]settings, read-only. Each parameter shows its current value, the compiled-in default (computed locally), and a one-line explanation of what it does; values that differ from the default are flaggedmodified. Secrets are summarized server-side (TLS as configured/not, the ack API key as set/unset) and never shown in clear. Needs a 0.8.8+ daemon; older ones show a hint.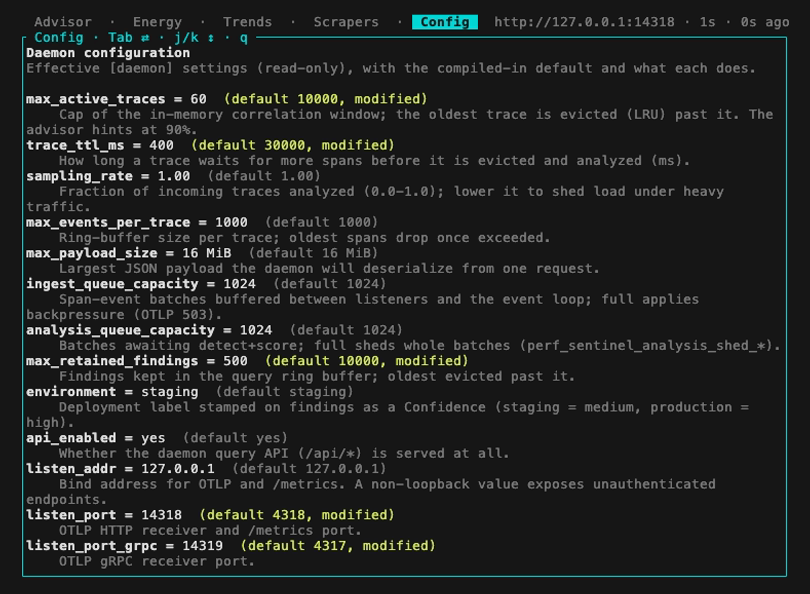
When the daemon becomes unreachable, the last good snapshot stays on
screen with a [STALE] indicator instead of going blank.
Both TUIs (this monitor and the Inspect browser) follow the terminal's
own theme: they use the 16 named ANSI colors and never impose a
background, so a light-themed terminal renders them on a light
background and a dark one on dark. Secondary text (titles, hints,
column headers) is drawn with the terminal's dim attribute rather than
a fixed gray, so it stays legible on either background. There is no
--theme flag: configure the colors in your terminal emulator.
ACK-WORKFLOW.mdfor the relationship between TOML CI acks and daemon JSONL acks, and the full decision table.CLI.mdfor theperf-sentinel acksubcommand reference (CLI-side equivalent ofa/u).HTML-REPORT.mdfor the browser-side ack flow via--daemon-url.QUERY-API.mdfor the/api/energyendpoint the Scrapers tab reads, and the daemon's read-only HTTP surface.CONFIGURATION.mdfor the[daemon.ack]server-side config reference.