Step I: Clarify the goal: e.g., Growth? Acquire new users? Retain old users?
Step II: Two good metrics + One guardrail metric
Example: launching a message app, define 2 metrics the you would choose to monitor app performance during the first months.
-
Acquire new users: new sign ups per day from users who send at least 1 message within the first 2 days
-
Retain current users: average message per day per user
-
DAU, MAU
-
Total time user spent with old features compared with the new features
-
Activities/Action per performed (e.g., messages sent)
-
Revenue
-
CTR
**Step I: ** Is this a good feature? Pick up a metric and think if the metric was successful.
Step II: Do people want it? Proof of demand. Find a proxy metric.
Step III: Then test it. A/B testing. How to split the user group? How long should we run the test.
Example: Should Facebook add a love button?
- Clarify the goal? What is the purpose of it? (Drive engagement --> define metric(s): action per user in a week).
- Will it drive the metrics if successful? (Sure, incentive more posts/reactions.)
- Do people want it? (Comment data --> sentiment analysis --> # of comments showing love)
- A/B testing
Data-driven Approach/Structure.
Go back to Define Metrics and Test new features.
Example: Which feature would you add to what app?
**Step I: ** Clarify the metric: how is it calculate?
Step II: Sudden or Stable?
- Sudden: technical issues in data pipeline. Or special event? Go over possibilities step by step, one by one.
Step III: Decompose the metric:
- E.g. DAU: Existing users + New users + Resurrected Users - Churned Users
Step IV: Segment products, or users and propose possibilities
Example: Rides per user in a week dropped 20% year over year
- Clarify the situation (regional scope, is it sudden or gradual?)
- Decompose the metric:
- Is last year data an anomaly?
- Rides/Users --> less ides, or more users.
- If more users --> segment users (region/channel)
- Discuss possibilities based on segmentation


| Element | Function | Relevant metrics |
|---|---|---|
| Acquisition | generate attention through a variety of means, both or- ganic and inorganic | traffic, mentions, cost per click, search results, cost of acquisition, open rate |
| Activation | turn the resulting drive-by visitors into users who are somehow enrolled | enrollments, signups, com- pleted onboarding process, used the service at least once, subscriptions |
| retention | Convince users to come back repeatedly, exhibiting sticky behavior | engagement, time since last visit, daily and monthly active use, churns |
| revenue | Business outcomes (which vary by your business model: purchases, ad clicks, content creation, subscriptions, etc.) | Customer lifetime value, con- version rate, shopping cart size, click-through revenue |
| referral | Viral and word-of-mouth invitations to other potential users | Invites sent, viral coefficient, viral cycle time |
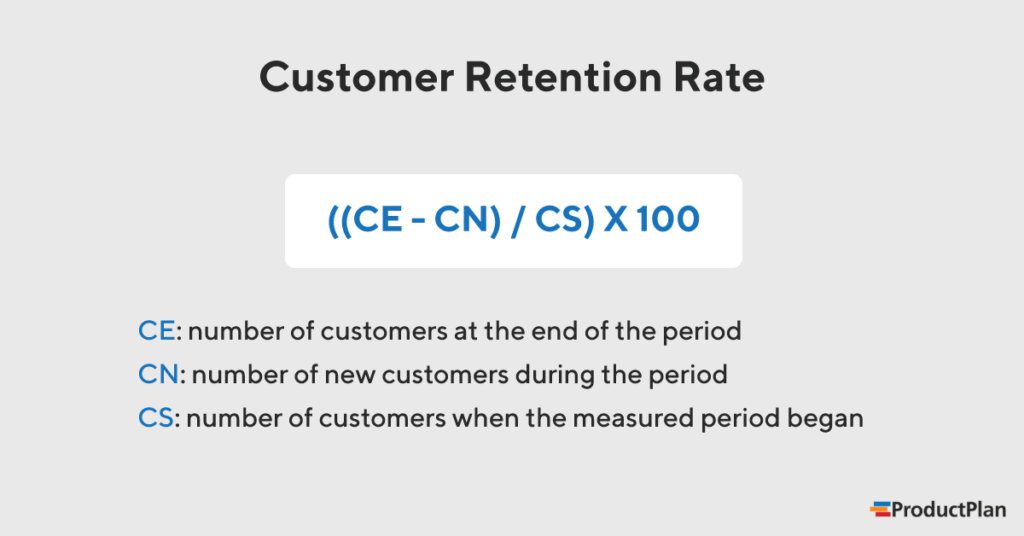
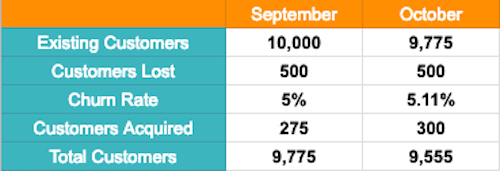
Let's say our company started September with 10K customers. At the end of the month, we found that 500 left our business. This would mean our churn rate is five percent ((10,000 customers - 9,500 customers ) / 10,000 customer = 5%).
Now, let's say we gained 275 customers during September and lost 500 more during October. Our churn rate for October would then be 5.11% ((9,775 customers - 9,225 customers) / 9,755 customers = 5.11%).
https://towardsdatascience.com/a-summary-of-udacity-a-b-testing-course-9ecc32dedbb1