Source Steger's Algorithm
This is the main curve extraction algorithm that is based on the source code from this paper. Some time ago I wrote a blog post about it. It is very similar to the Ridge Detection plugin, they both are based on the same C code from the mentioned paper (but the user interface and implementations are different).
There are two steps in line detection.
The first one is a specification of parameters in dialog.
The second (see below) is a determination of lower and upper tracing thresholds.
Upon start, detection parameters window appears:
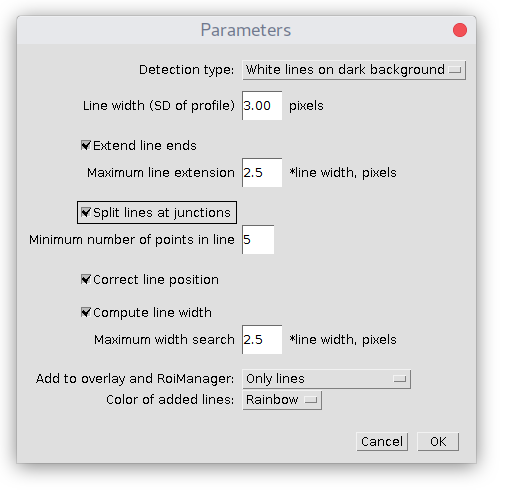
Here is a brief explanation:
Depending on the image type you have, the plugin can detect white lines in a black background, or on the opposite, dark lines on a white background.
This is the approximate width of lines/curves in pixels. For curves observed in microscopy images, their transverse intensity profile is very often Gaussian (reflecting PSF of a microscope). More precisely, this line width is a standard deviation of this Gaussian. For your specific images, before starting the plugin, you can draw a small line ROI perpendicular to a typical curve, get intensity profile (Analyze->Plot Profile), fit it to a Gaussian function (Data->Add Fit.../Fit Function: Gaussian) and get the value of SD (parameter d value, should be in pixels). It is an estimate, I recommend trying different values around it and choose the best result.
In this case, the plugin will try to continue (extend) ends of detected lines for the length of the value, specified by "Maximum line extension" parameter.
Apart from line segments, the algorithm is able to detect junctions (where ends of segments meet) or intersections of lines.
With this option selected, it will try to resolve these intersections, i.e. connect the ends of line segments that meet and join them together to a new line/curve. The resolution of intersections does not always work properly.
If the option is not selected, at each junction/intersection the algorithm will split lines to separate line segments.
Lines/curves containing fewer points than the number of this threshold will be omitted from detection/results.
After the line detection step, the algorithm will try to refine the central position of each point, using a simplified fit to the transverse profile (see the paper for details).
If this option is unchecked, the plugin returns only line segments (central position of lines). Upon selection of this option, the plugin tries to estimate line width by detecting its left and right boundaries (assuming Gaussian/parabolic profile). See the reference paper above for the details of the procedure. "Maximum width search" parameter limits the search of line boundaries to the provided range.
Detected curves will be added to the image overlay and RoiManager. The existing overlay will be removed, while new curves ROIs will be added to the ROI manager (any previously added ROIs will be preserved). "Average width" and "boundaries" option will work only if "Compute line width" option above was selected. The colors of added lines are specified by the selection box.
After clicking OK, line tracing threshold selection windows appear:
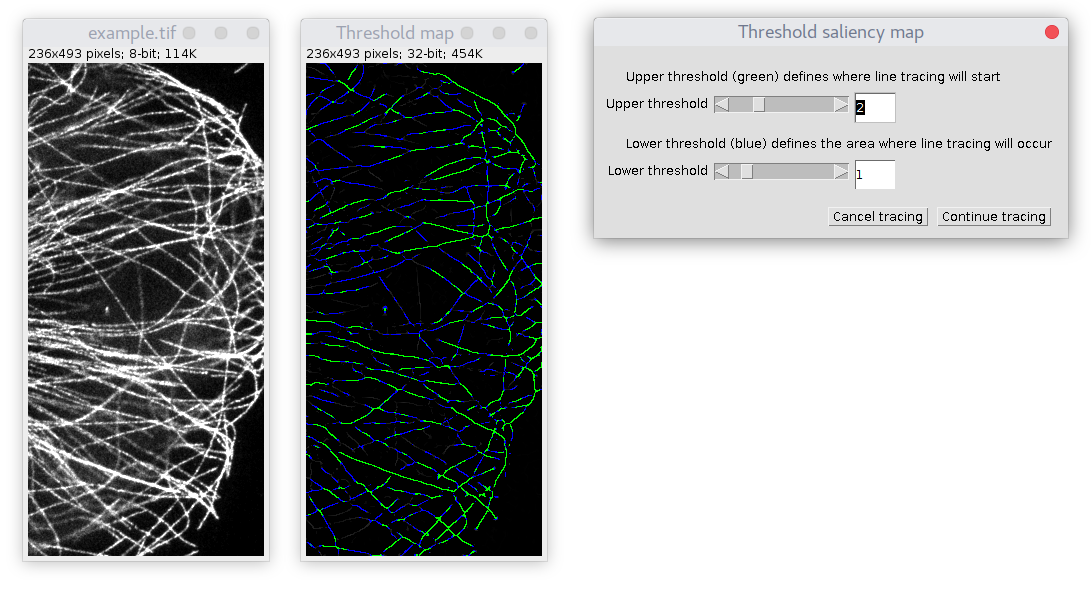
Here, on the left is an example image. In the middle is the saliency map, it is a kind of precomputed probability per each pixel that it contains a curve/line. On the right, there is a window with two thresholds selections sliders (high and low).
The upper threshold defines "seeds" of new curves, this is where tracing will start. Its corresponding area is marked with green color. All green pixels end up in curves.
The lower threshold defines the area (marked in blue), where the algorithm can "extend" curve tracings that will start from green nucleation "seeds". If there is a blue area without a green seed within it, it will not be traced.
The values of both thresholds can be fractional (the slider does not always allow it).
The remaining black area is excluded from curves.