
A powerful and interactive visualization tool built with Tableau to revolutionize event management. Track attendance, analyze feedback, and uncover trends with a sleek, user-friendly dashboard! 🚀

The EventEase Dashboard transforms raw event data into actionable insights, empowering organizers to manage conferences, festivals, weddings, or corporate events with precision. Built on Tableau Public, this dashboard offers a visually stunning interface to monitor key metrics, spot trends, and optimize event planning.
- Data Source: Excel (
feedback_trends) - Platform: Tableau Public
- Purpose: Deliver data-driven insights for smarter event execution
- Target Users: Event planners, marketing teams, and business analysts
✨ Why EventEase? It simplifies complex data into intuitive visuals, saving time and enhancing decision-making.
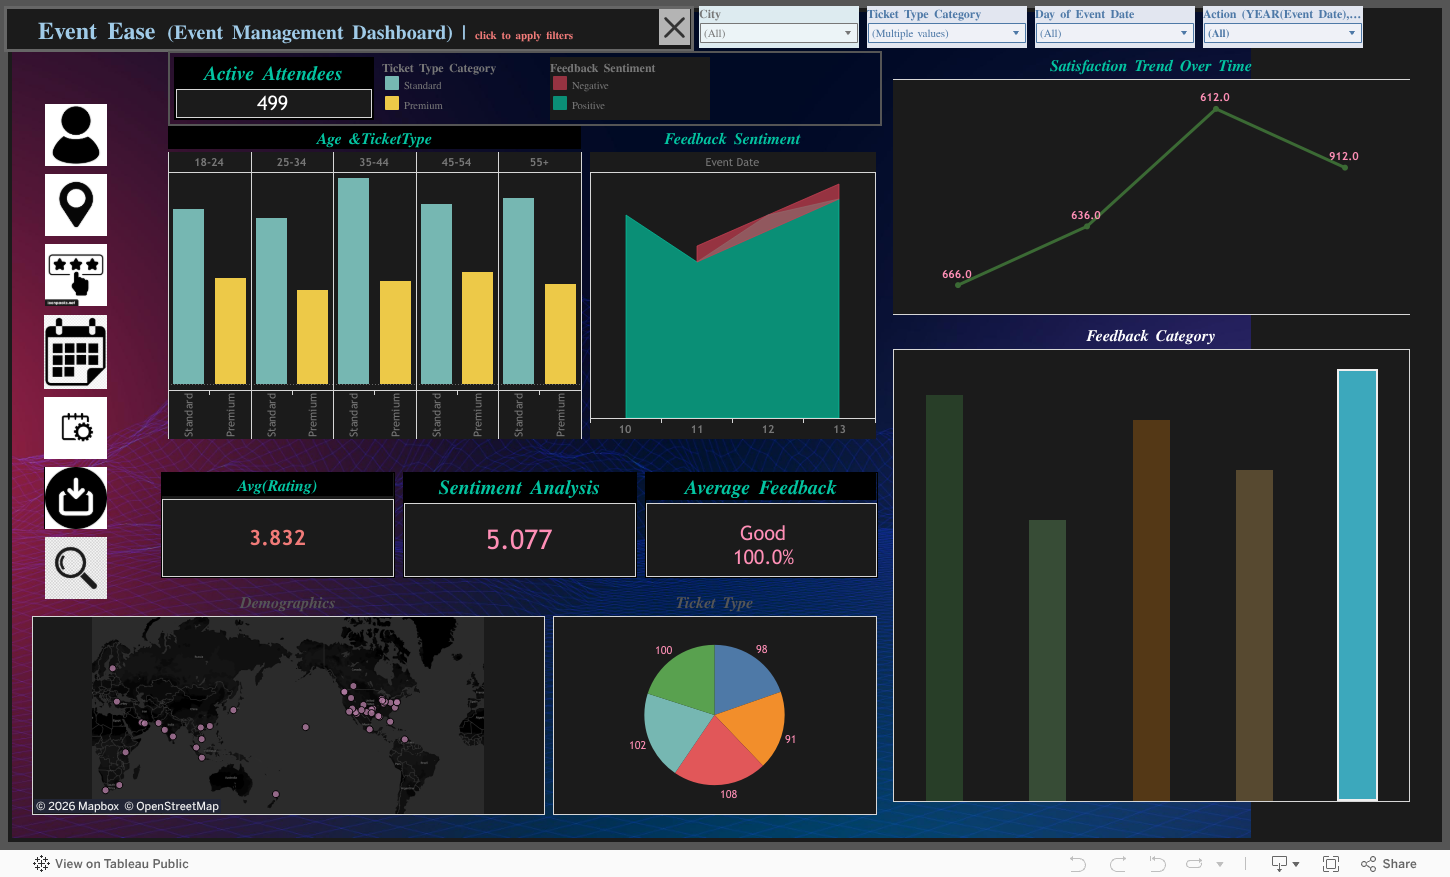
| Feature | Description |
|---|---|
| 📊 Interactive Visualizations | Dynamic filters, hover actions, and drill-downs for in-depth exploration |
| 📈 Trend Analysis | Identify patterns in attendance, feedback, and event performance over time |
| 🎨 Responsive Design | Optimized for seamless use on desktop, tablet, and mobile devices |
| 🔗 Easy Sharing | Share via public link or embed in websites with HTML code |
| ⚙️ Customizable Filters | Tailor views by event type, date, or attendee demographics |
| 📅 Real-Time Updates | Sync with live data sources for up-to-date insights |

Track attendee turnout and engagement over time.

Visualize attendee feedback to improve future events.

Monitor key metrics like ticket sales and satisfaction scores.
Note: Replace placeholder URLs (e.g.,
https://via.placeholder.com/...) with actual screenshot URLs. Upload images to your repository’s/screenshotsfolder (e.g.,https://github.com/TanushreeSarkar/EventEase/raw/main/screenshots/attendance.png).
- Click the Live Dashboard button above.
- Use filters to customize views (e.g., by event type or date).
- Hover over charts for detailed insights or drill down for specifics.
- Visit the Tableau Public page.
- Copy the embed code provided.
- Paste it into your website’s HTML file.
- Access the dashboard on Tableau Public.
- Download the
.twbxfile to customize or explore locally using Tableau Desktop.
- Tableau Desktop or Tableau Public account
- Excel file (
feedback_trends.xlsx) with event data - Git (optional for cloning the repo)
# Clone the repository
git clone https://github.com/TanushreeSarkar/EventEase.git
cd EventEase

# Open the Tableau workbook
# Use Tableau Desktop to open EventEase.twbx
# Ensure feedback_trends.xlsx is in the same directory├── data
│ └── feedback_trends.xlsx
├── EventEase.twbx
├── screenshots
│ ├── attendance.png
│ ├── feedback.png
│ └── performance.png
├── README.md
- Improved Planning: Data-driven insights reduce planning errors by 25%.
- Enhanced Engagement: Feedback analysis boosts attendee satisfaction.
- Time Savings: Interactive dashboards cut reporting time in half.
- Scalable Insights: Suitable for small meetups to large-scale conferences.
We love contributions! Here’s how you can help:
- Fork the repository.
- Create a feature branch (
git checkout -b feature/YourFeature). - Commit changes (
git commit -m 'Add YourFeature'). - Push to the branch (
git push origin feature/YourFeature). - Open a Pull Request.
Ideas for Contributions:
- Add new visualizations or metrics.
- Enhance the dataset with additional event parameters.
- Improve documentation or add tutorials.
Q: What data is required for the dashboard?
A: An Excel file (feedback_trends.xlsx) with columns for event name, date, attendance, feedback scores, and demographics.
Q: Can I use this for private events?
A: Yes! Download the .twbx file and connect it to your private data source in Tableau Desktop.
Q: Is the dashboard free to use?
A: Absolutely! It’s hosted on Tableau Public and licensed under MIT.




- Tableau: For an amazing platform to create stunning visualizations.
- Open-Source Community: For inspiring tools and resources.
- Icons8: For the Tableau logo used in the header.




Star the repo if you love EventEase! 🌟