No procedures or tools for profiling #150
Description
Ravenbrook staff use profiling to optimise the MPS, but we don't have documented procedures or tools to help. We are a bit ad-hoc. It would help everyone to document and maintain profiling methods, especially since some of them are a pain to set up (see below).
Maybe using
perfwould be an alternative togprof?
Originally posted by @waywardmonkeys in #138 (comment)
Here's an article on various profiler options https://euccas.github.io/blog/20170827/cpu-profiling-tools-on-linux.html
valgrind crashes (dumps core) on gcbench though.
Posted by @rptb1 in keybase://chat/ravenbrook#mps/2226
Dat critical path! (from sysprof-cli -- lii6gc/hot/gcbench -x 6415986 amc)
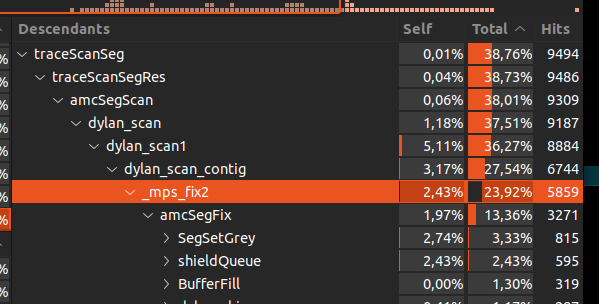
Posted by @rptb1 in keybase://chat/ravenbrook#mps/2231
I'm just starting to get some interesting stuff come out of Intel vtune. It was a bit of a pain to set up
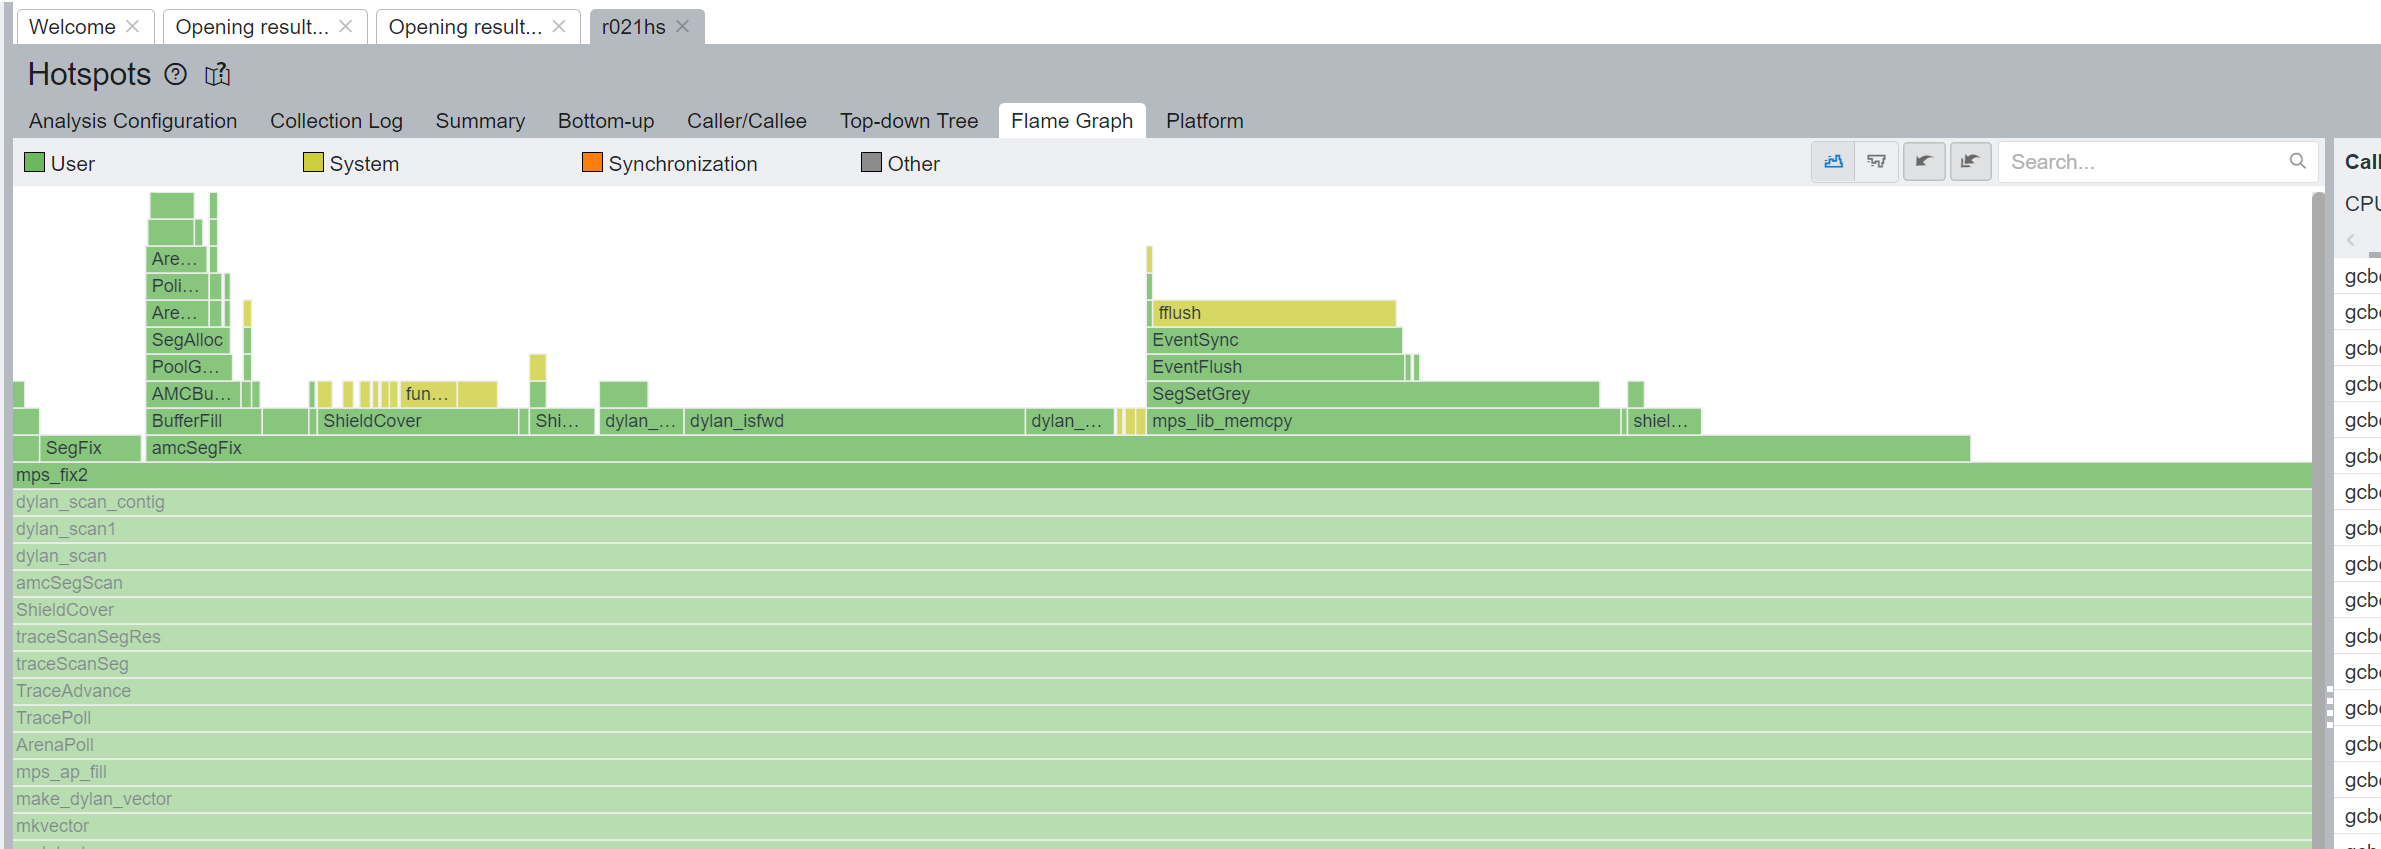
Posted by @thejayps in keybase://chat/ravenbrook#mps/2333