This module allows to generate and render some pie charts for your Odoo projects.
It consists of two pie charts on the project form view:
- number of installed modules
- number of lines of code
Both measures are split based on some criteria (configurable), by default:
- Odoo CE
- Odoo Enterprise
- OCA
- Community (not OCA)
- Specific code
- Misc. (everything not part of other criteria above)
Each criteria having a rendering color used on the charts.
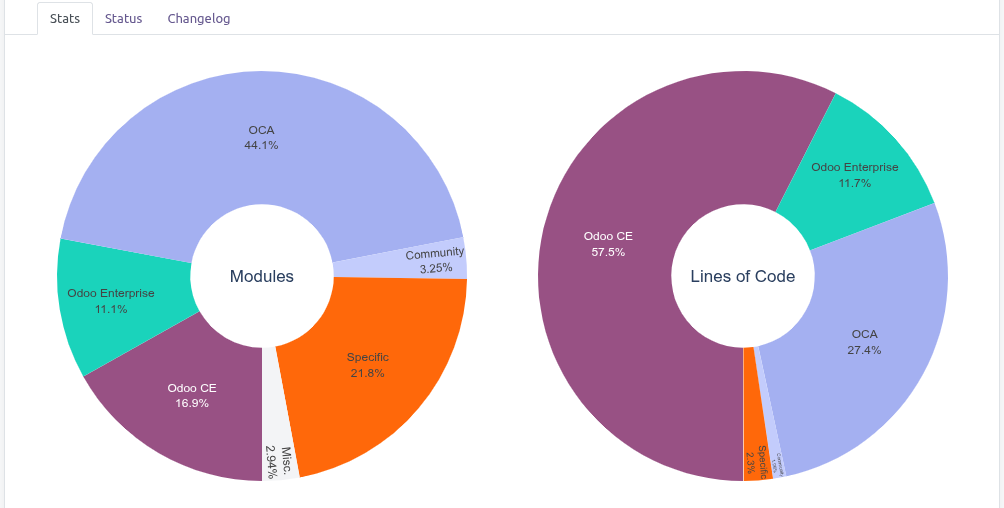
Table of contents
Bugs are tracked on GitHub Issues. In case of trouble, please check there if your issue has already been reported. If you spotted it first, help us to smash it by providing a detailed and welcomed feedback.
Do not contact contributors directly about support or help with technical issues.
- Camptocamp
- Camptocamp
- Sébastien Alix <seb@usr-src.org>
This module is maintained by the OCA.
OCA, or the Odoo Community Association, is a nonprofit organization whose mission is to support the collaborative development of Odoo features and promote its widespread use.
This module is part of the OCA/module-composition-analysis project on GitHub.
You are welcome to contribute. To learn how please visit https://odoo-community.org/page/Contribute.