Danfo.js
Danfo.js is an open-source, JavaScript library providing high-performance, intuitive, and easy-to-use data structures for manipulating and processing structured data.
Danfo.js is heavily inspired by the Pandas library and provides a similar interface and API. This means users familiar with the Pandas API can easily use Danfo.js.
- HTML tables, instead of ACII tables in outputs.
- Render plots with danfo.js even when using node.js
- This extension leverages the power of notebooks and lifts the restriction of not being able to use danfo.js plotting in node.js.
import * as dfd from 'danfojs-node';
const df = await dfd.read_csv("https://web.stanford.edu/class/archive/cs/cs109/cs109.1166/stuff/titanic.csv");
df.head().print();
s = new dfd.Series([1, 3, 5, undefined, 6, 8])
s.print()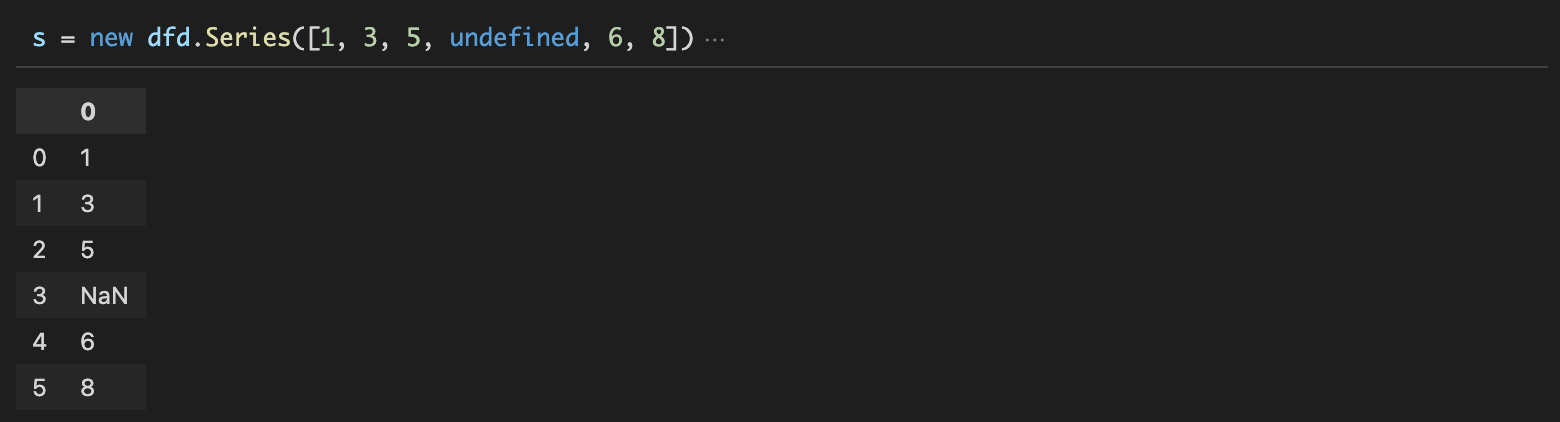
import * as dfd from 'danfojs-node';
const df = await dfd.read_csv("https://raw.githubusercontent.com/plotly/datasets/master/finance-charts-apple.csv")

var layout = {
    title: 'A financial charts',
    xaxis: {
        title: 'Date',
    },
    yaxis: {
        title: 'Count',
    }
}

new_df = df.set_index({ key: "Date" })
new_df.plot("plot_div").line({ columns: ["AAPL.Open", "AAPL.High"], layout: layout })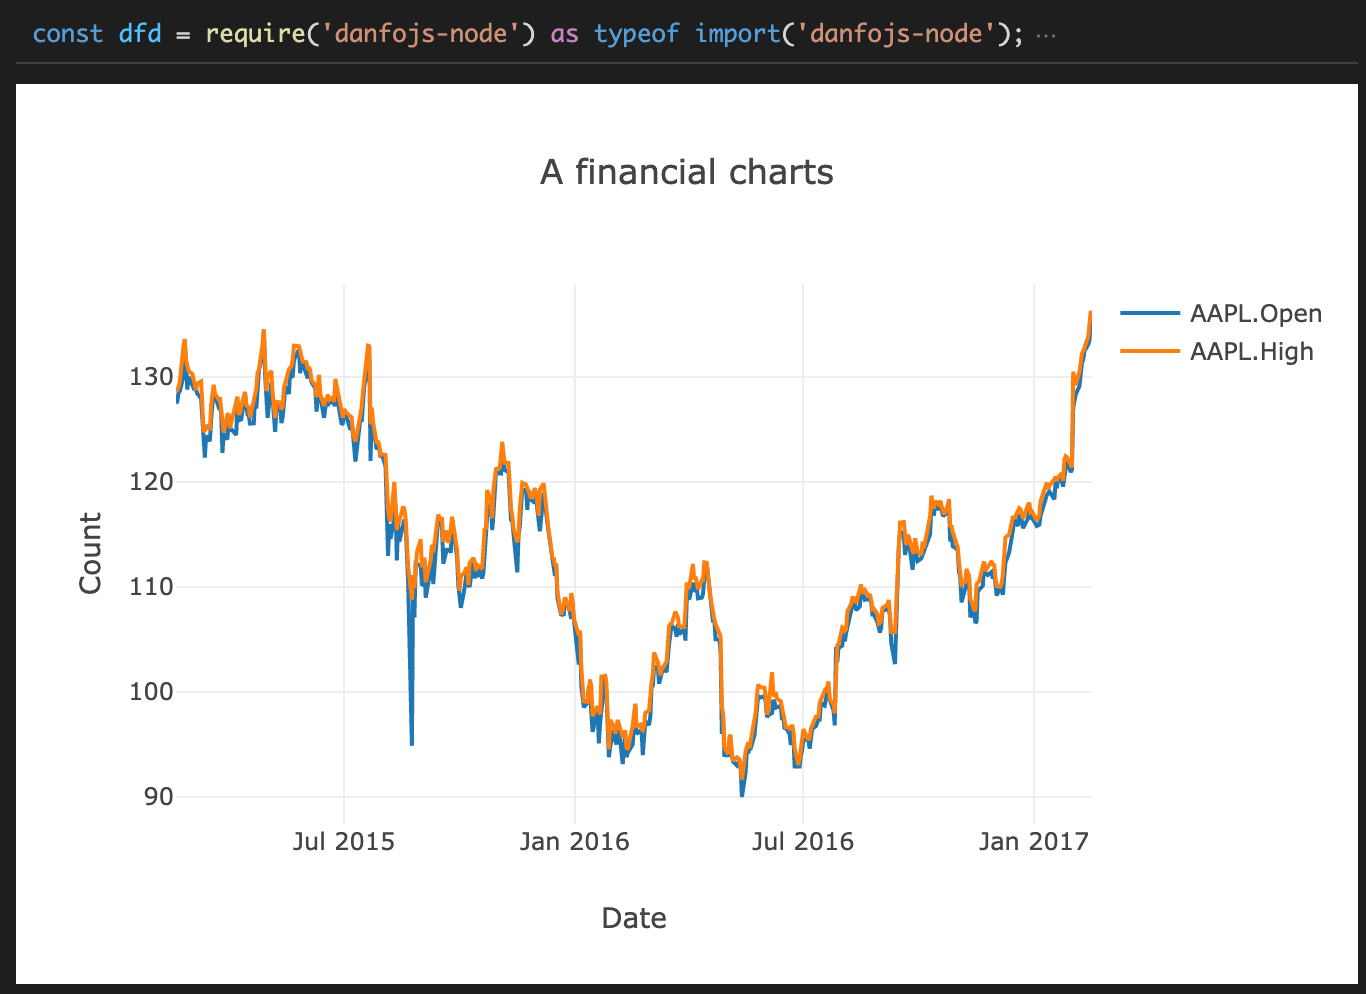
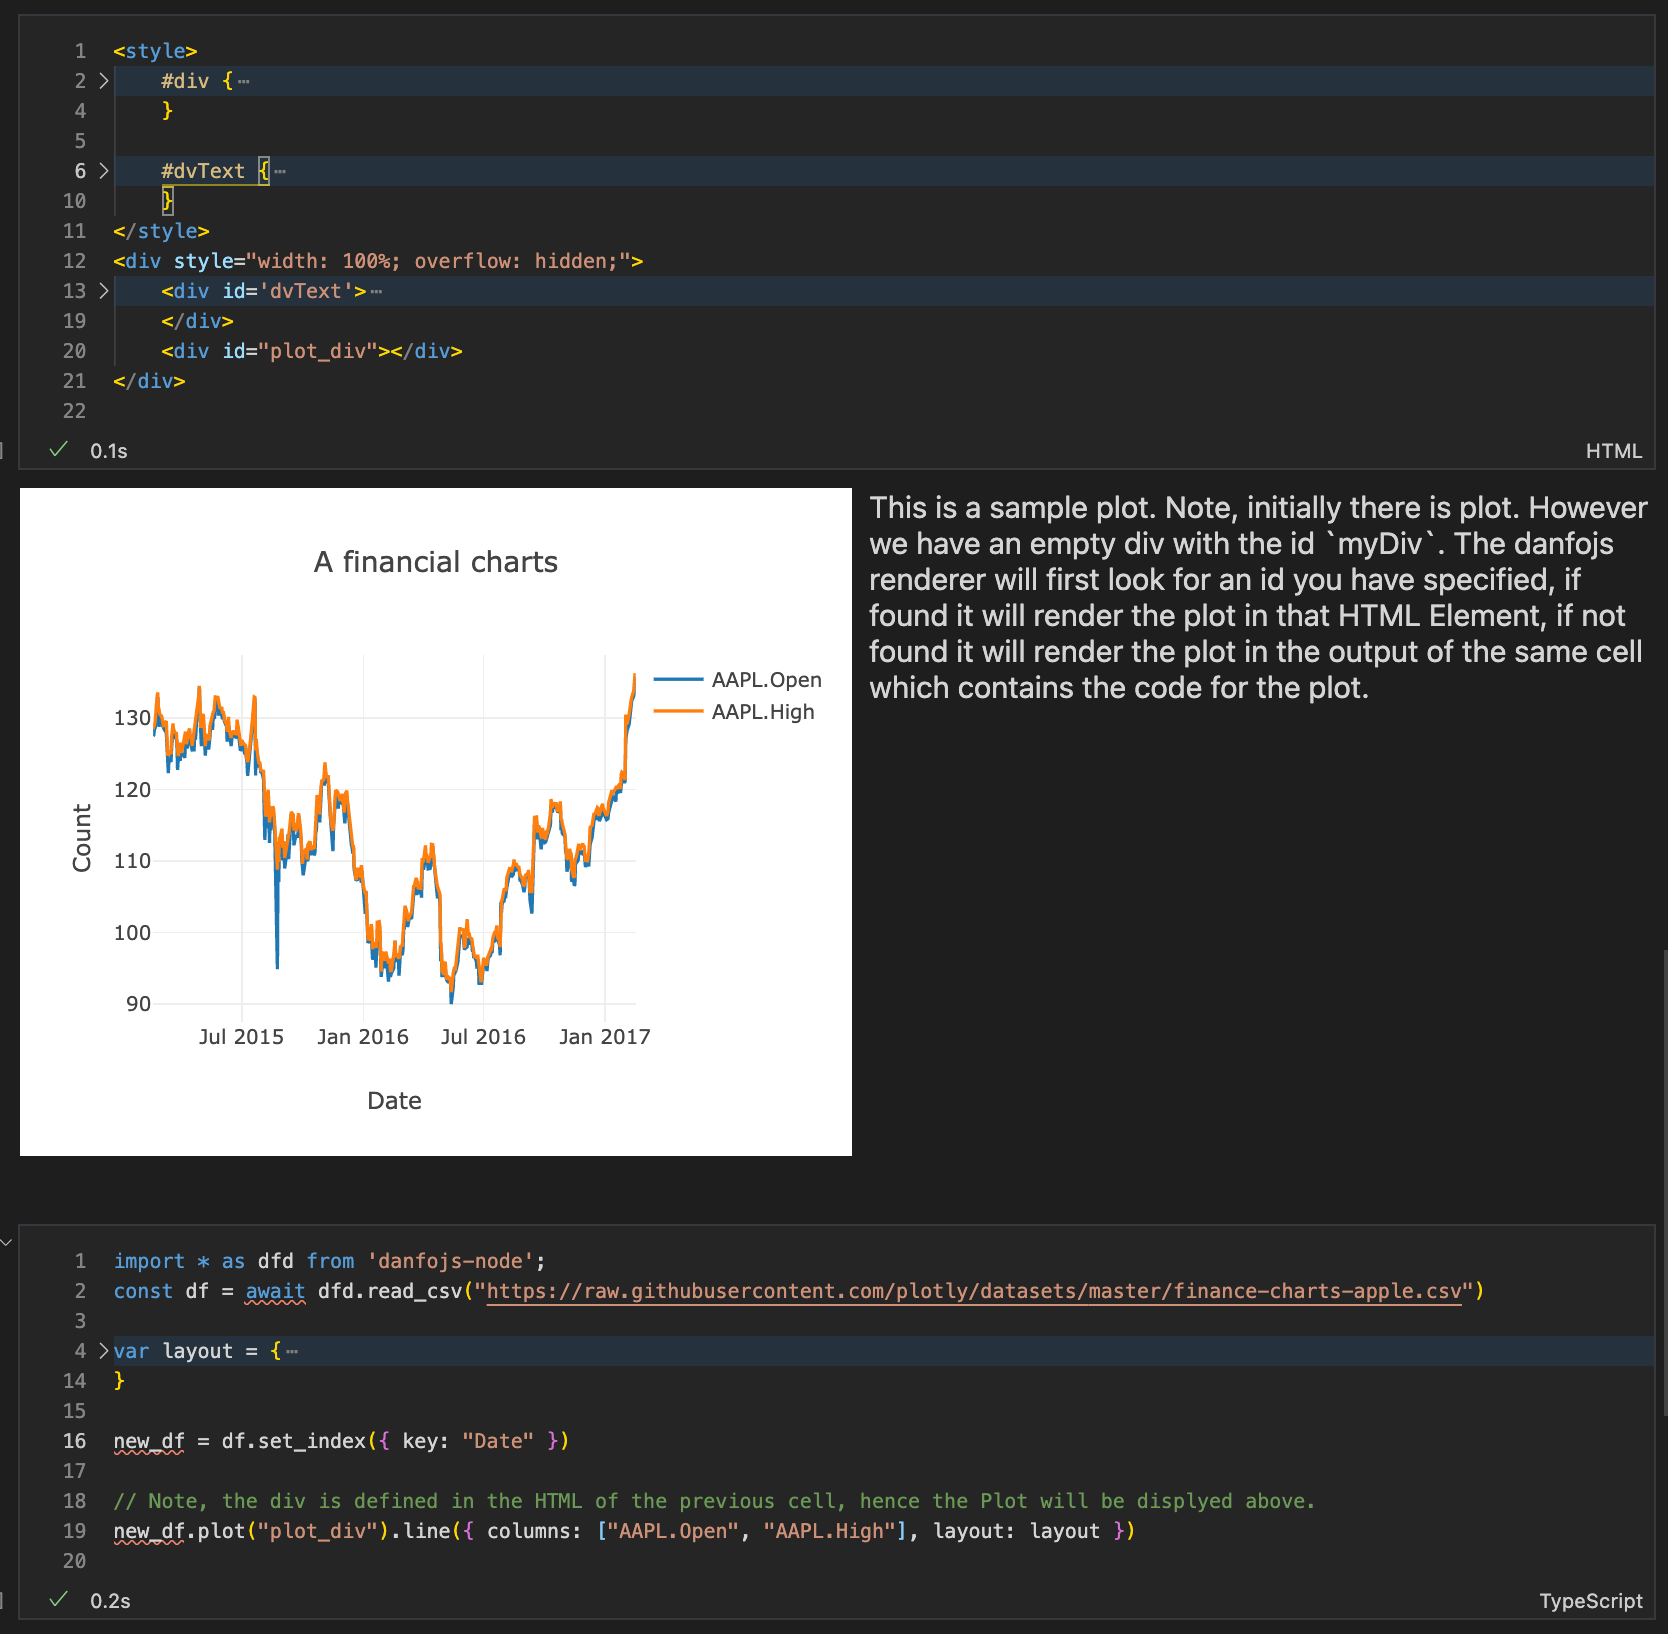
- Create an HTML cell with the following markup & run this.
<style>
    #div {
        width: 500px;
    }

    #dvText {
        margin-left: 510px;
        font-size: large;
        float: left;
    }
</style>
<div style="width: 100%; overflow: hidden;">
    <div id='dvText'>
        This is a sample plot. Note, initially there is plot.
        However we have an empty div with the id `myDiv`.
        The danfojs renderer will first look for an id you have specified, if found it will render the plot in that HTML
        Element, if not found
        it will render the plot in the output of the same cell which contains the code for the plot.
    </div>
    <div id="plot_div"></div>
</div>- Next create a JavaScript cell with the followig code and run it
import * as dfd from 'danfojs-node';
const df = await dfd.read_csv("https://raw.githubusercontent.com/plotly/datasets/master/finance-charts-apple.csv")

var layout = {
    title: 'A financial charts',
    xaxis: {
        title: 'Date',
    },
    yaxis: {
        title: 'Count',
    }
}

new_df = df.set_index({ key: "Date" })

// Note, the div is defined in the HTML of the previous cell, hence the Plot will be displyed above.
new_df.plot("plot_div").line({ columns: ["AAPL.Open", "AAPL.High"], layout: layout })- Note how the plot is injected into the HTMl generated by the first cell (because the element named
plot_divexists in the output of the first cell).