A unique tool for better analysis of Stock Market. This library can scrape the web for a lot of stock related data which can help you with detailed analysis of the market.
Install with:
pip install StockerDataframe
For Google Colab:
!pip install StockerDataframe
Stock market analysis enables investors to identify the intrinsic worth of a security even before investing in it. All stock market tips are formulated after thorough research by experts. Stock analysts try to find out activity of an instrument/sector/market in future.
By using stock analysis, investors and traders arrive at equity buying and selling decisions. Studying and evaluating past and current data helps investors and traders to gain an edge in the markets to make informed decisions. Fundamental Research and Technical Research are two types of research used to first analyze and then value a security.
Performing a research before making an investment is a must. It is only after a thorough research that you can make some assumptions into the value and future performance of an investment. Even if you are following stock trading tips, it ideal to do some research, just to ensure that you are making an investment that’s expected to get you maximum returns.
When you invest in equity, you purchase some portions of a business expecting to make money upon increase in the value of the business. Before buying anything, be it a car or phone, you do some degree of research about its performance and quality. An investment is no different. It is your hard earned money that you are about to invest, so you must have a fair knowledge of what you are investing in.
One of the key factors for traders is tracking the best and worst performing stocks over a period of time. With StockerDataframe, you can easily scrape the web for a lot of stock related data which can help you with detailed analysis of the market.
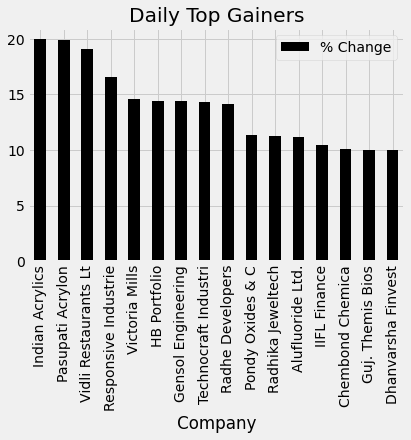
To extract the performers of a particular day in BSE and save them locally in a CSV file format. We can get the % change and Company name in the CSV file which can be used for further advanced Data Analysis.
from StockerDataframe import gainers as gn

gn.daily_gainers()
OUTPUT:
Company	              % Change
Indian Acrylics	+20.00
Pasupati Acrylon	+19.91
Vidli Restaurants Lt	+19.12
Responsive Industrie	+16.60
Victoria Mills	+14.60
HB Portfolio	+14.41
Gensol Engineering	+14.38
Technocraft Industri	+14.28
Radhe Developers	+14.11
Pondy Oxides & C	+11.39
from StockerDataframe import gainers as gn

gn.plot_daily_gainers()
OUTPUT:
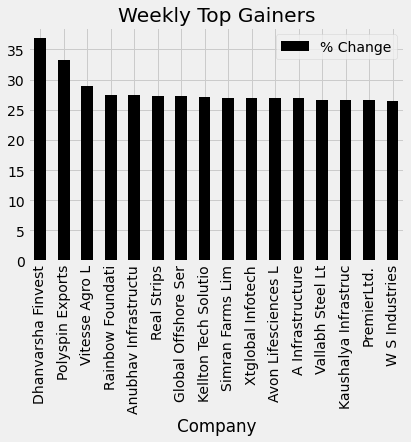
To extract the Top performers of a particular week in BSE and save them locally in a CSV file format. We can get the % change and Company name in the CSV file which can be used for further advanced Data Analysis.
from StockerDataframe import gainers as gn

gn.weekly_gainers()
OUTPUT:
Company	              % Change
Dhanvarsha Finvest	+36.84
Polyspin Exports	+33.19
Vitesse Agro L	+28.89
Rainbow Foundati	+27.44
Anubhav Infrastructu	+27.38
Real Strips	+27.35
Global Offshore Ser	+27.27
Kellton Tech Solutio	+27.18
Simran Farms Lim	+26.98
from StockerDataframe import gainers as gn

gn.plot_weekly_gainers()
OUTPUT:
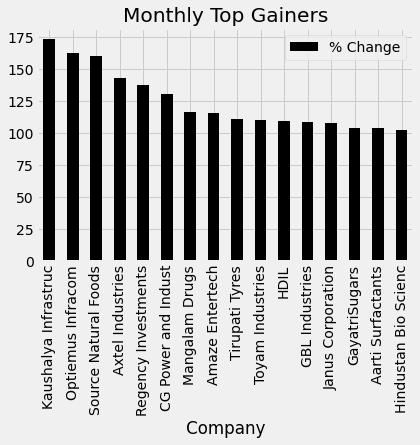
To extract the Top performers of a particular week in BSE and save them locally in a CSV file format. We can get the % change and Company name in the CSV file which can be used for further advanced Data Analysis.
from StockerDataframe import gainers as gn

gn.monthly_gainers()
OUTPUT:
Company	              % Change
Kaushalya Infrastruc	+173.40
Optiemus Infracom	+162.00
Source Natural Foods	+160.36
Axtel Industries	+142.98
Regency Investments	+137.73
CG Power and Indust	+130.73
Mangalam Drugs	+116.51
Amaze Entertech	+115.63
Tirupati Tyres	+110.75
from StockerDataframe import gainers as gn

gn.plot_monthly_gainers()
OUTPUT:
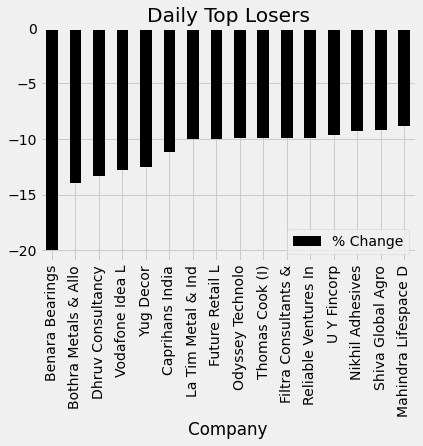
To extract the worst performers of a particular day in BSE and save them locally in a CSV file format. We can get the % change and Company name in the CSV file which can be used for further advanced Data Analysis.
from StockerDataframe import losers as lr

lr.daily_losers()
OUTPUT:
Company	              % Change
Benara Bearings	-20.0
Bothra Metals & Allo	-14.0
Dhruv Consultancy	-13.33
Vodafone Idea L	-12.76
Yug Decor	-12.5
Caprihans India	-11.19
La Tim Metal & Ind	-10.0
Future Retail L	-9.98
Odyssey Technolo	-9.95
from StockerDataframe import losers as lr

lr.plot_daily_losers()
OUTPUT:
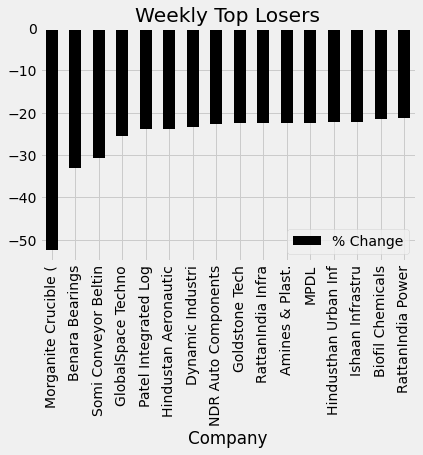
To extract the worst performers of a particular week in BSE and save them locally in a CSV file format. We can get the % change and Company name in the CSV file which can be used for further advanced Data Analysis.
from StockerDataframe import losers as lr

lr.weekly_losers()
OUTPUT:
Company	              % Change
Morganite Crucible (	-52.38
Benara Bearings	-33.13
Somi Conveyor Beltin	-30.64
GlobalSpace Techno	-25.59
Patel Integrated Log	-23.94
Hindustan Aeronautic	-23.91
Dynamic Industri	-23.33
NDR Auto Components	-22.57
Goldstone Tech	-22.44
from StockerDataframe import losers as lr

lr.plot_weekly_losers()
OUTPUT:
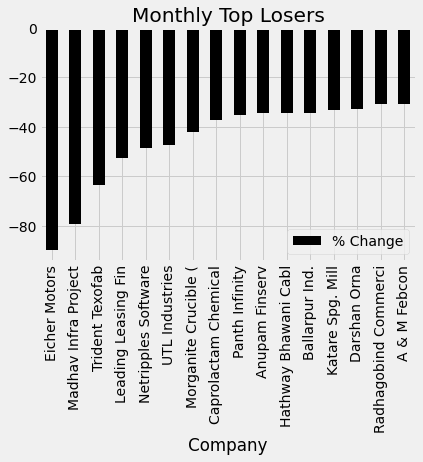
To extract the worst performers of a particular week in BSE and save them locally in a CSV file format. We can get the % change and Company name in the CSV file which can be used for further advanced Data Analysis.
from StockerDataframe import losers as lr

lr.monthly_losers()
OUTPUT:
Company	              % Change
Eicher Motors	-89.68
Madhav Infra Project	-79.26
Trident Texofab	-63.33
Leading Leasing Fin	-52.62
Netripples Software	-48.68
UTL Industries	-47.12
Morganite Crucible (	-41.91
Caprolactam Chemical	-37.37
Panth Infinity	-35.2
from StockerDataframe import losers as lr

lr.plot_monthly_losers()
OUTPUT:
from StockerDataframe import historicaldata as hd

hd.financeData.getYahooData('', 'tsla', '2020-03-18')
OUTPUT : 559.9399795532227
from StockerDataframe import historicaldata as hd
hd.financeData.getYahooData('', 'msft', '2020-05-18')
OUTPUT = 37.839996337890625

